






"Caribbean" region includes following countries:
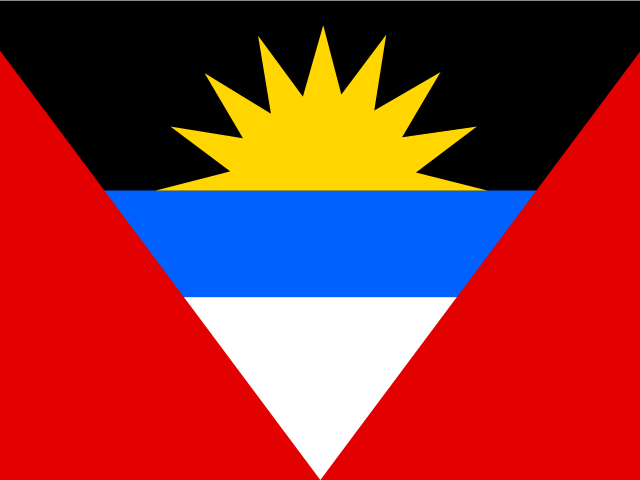 Antigua and Barbuda
 the Bahamas
 Barbados
 British Virgin Islands
 Cayman Islands
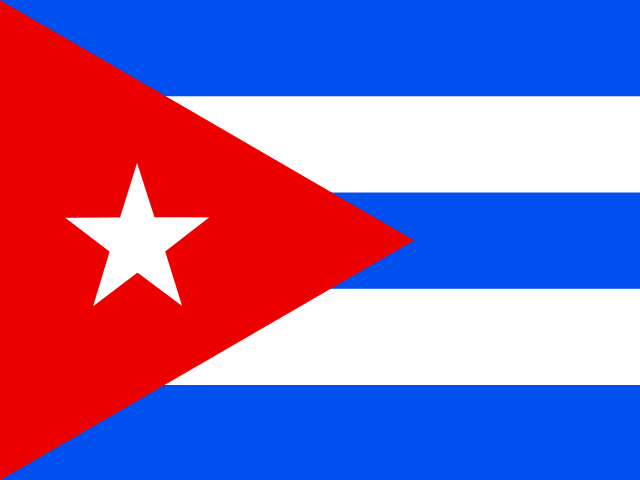 Cuba
Cuba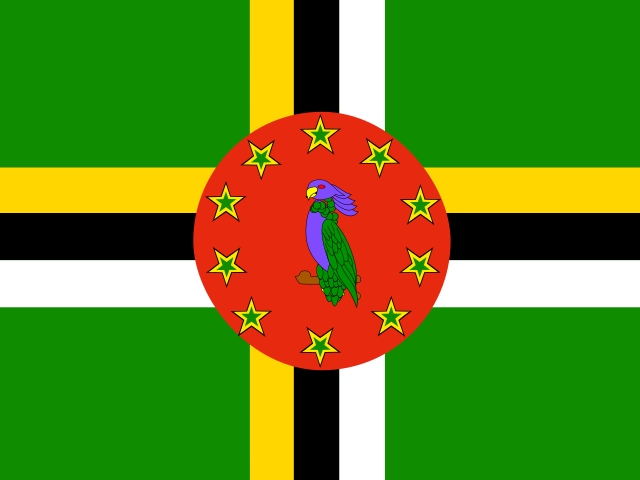 Dominica
 Dominican Republic
 Grenada
 Guadeloupe
 Haiti
Haiti Jamaica
 Martinique
 Montserrat
 Curacao
 Aruba
Aruba Saint Maarten (Dutch part)
 Bonaire
 Puerto Rico
 Saint Kitts and Nevis
 Anguilla
 Saint Lucia
 Saint-Martin (French Part)
 Saint Vincent and the Grenadines
 Trinidad and Tobago
 Turks and Caicos Islands
 United States Virgin Islands
Earlier Report Observations
The Caribbean watermelon market experienced strong and sustained growth from 2018 to 2023. Production volumes rose from 474 thousand tons to 891 thousand tons, driving a corresponding expansion in total market size from 478 thousand tons to 894 thousand tons over the same period. This growth was particularly pronounced in the final two years, where output surged by nearly 40% in 2022 and a further 25% in 2023.
The market's expansion was almost entirely fueled by the increase in domestic production, as import and export volumes remained relatively minor throughout the period. Trade flows had a negligible impact on the overall market volume, which closely tracked the domestic production trend. The period concluded with the market nearly doubling in size compared to its 2018 level.
Table of content
- 1. Disclaimer
- 2. Terms of use of the report
- 3. Product codes in the statistical classifications used in the report
-
4. Key Market Indicators and Trends
-
4.1. Key Market Indicators
-
4.1.1. In kind
- 4.1.1.1. Production, 2018-2023
- 4.1.1.2. Imports, 2018-2024
- 4.1.1.3. Exports, 2018-2024
- 4.1.1.4. Market size, 2018-2023
-
4.1.1. In kind
- 4.2. Market Trends and Factors
-
4.1. Key Market Indicators
-
5. Production
-
5.1. Production in Caribbean
- 5.1.1. Annual dynamics of production in Caribbean in kind, 2018-2023, K t
-
5.2. Global production by Country, 2018-2023
- 5.2.1. Annual dynamics of production by macroregions in kind, 2018-2023, K t
- 5.2.2. Dynamics of production structure by macroregions in kind, 2018-2023
- 5.2.3. Annual dynamics of production by country in kind, 2018-2023, K t
- 5.2.4. Structure of production by countries in kind, 2018-2023
- 5.2.5. Dynamics of peoduction structure by countries in kind, 2018-2023
-
5.1. Production in Caribbean
-
6. Exports
-
6.1. Exports (Direct Data*)
- 6.1.1. Exports - Total information
-
6.1.2. Exports in kind, t
- 6.1.2.1. Annual dynamics of product's exports from Antigua and Barbuda in kind, 2018-2024, t
- 6.1.2.2. Dynamics of product's exports in kind from Antigua and Barbuda by countries, 2018-2024, t
- 6.1.2.3. Structure of product's exports in kind by countries, 2018-2024
-
6.1.3. Exports in value, K $ US
- 6.1.3.1. Annual dynamics of product's exports from Antigua and Barbuda in value, 2018-2024, K $ US
- 6.1.3.2. Dynamics of product's exports in value from Antigua and Barbuda by countries, 2018-2024, K $ US
- 6.1.3.3. Structure of product's exports in value by countries, 2018-2024
-
6.1.4. Average price of product's exports, $ US/t
- 6.1.4.1. Annual dynamics of average price of product's exports from Antigua and Barbuda, 2018-2024, $ US/t
- 6.1.4.2. Dynamics of average price of product's exports from Antigua and Barbuda by countries, 2018-2024, $ US/t
-
6.2. Exports (Mirror Data)
- 6.2.1. Exports - Total information
-
6.2.2. Exports in kind, t
- 6.2.2.1. Annual dynamics of product's exports from Antigua and Barbuda in kind, 2018-2024, t
- 6.2.2.2. Dynamics of product's exports in kind from Antigua and Barbuda by countries, 2018-2024, t
- 6.2.2.3. Structure of product's exports in kind by countries, 2018-2024
-
6.2.3. Exports in value, K $ US
- 6.2.3.1. Annual dynamics of product's exports from Antigua and Barbuda in value, 2018-2024, K $ US
- 6.2.3.2. Dynamics of product's exports in value from Antigua and Barbuda by countries, 2018-2024, K $ US
- 6.2.3.3. Structure of product's exports in value by countries, 2018-2024
-
6.2.4. Average price of product's exports, $ US/t
- 6.2.4.1. Annual dynamics of average price of product's exports from Antigua and Barbuda, 2018-2024, $ US/t
- 6.2.4.2. Dynamics of average price of product's exports from Antigua and Barbuda by countries, 2018-2024, $ US/t
-
6.1. Exports (Direct Data*)
-
7. Imports
-
7.1. Imports (Direct Data*)
- 7.1.1. Imports - Total information
-
7.1.2. Imports in kind, t
- 7.1.2.1. Annual dynamics of product's imports to Antigua and Barbuda in kind, 2018-2024, t
- 7.1.2.2. Dynamics of product's imports in kind to Antigua and Barbuda by countries, 2018-2024, t
- 7.1.2.3. Structure of product's imports in kind by countries, 2018-2024
-
7.1.3. Imports in value, K $ US
- 7.1.3.1. Annual dynamics of product's imports to Antigua and Barbuda in value, 2018-2024, K $ US
- 7.1.3.2. Dynamics of product's imports in value to Antigua and Barbuda by countries, 2018-2024, K $ US
- 7.1.3.3. Structure of product's imports in value by countries, 2018-2024
-
7.1.4. Average price of product's imports, $ US/t
- 7.1.4.1. Annual dynamics of average price of product's imports to Antigua and Barbuda, 2018-2024, $ US/t
- 7.1.4.2. Dynamics of average price of product's imports to Antigua and Barbuda by countries, 2018-2024, $ US/t
-
7.2. Imports (Mirror Data)
- 7.2.1. Imports - Total information
-
7.2.2. Imports in kind, t
- 7.2.2.1. Annual dynamics of product's imports to Antigua and Barbuda in kind, 2018-2024, t
- 7.2.2.2. Dynamics of product's imports in kind to Antigua and Barbuda by countries, 2018-2024, t
- 7.2.2.3. Structure of product's imports in kind by countries, 2018-2024
-
7.2.3. Imports in value, K $ US
- 7.2.3.1. Annual dynamics of product's imports to Antigua and Barbuda in value, 2018-2024, K $ US
- 7.2.3.2. Dynamics of product's imports in value to Antigua and Barbuda by countries, 2018-2024, K $ US
- 7.2.3.3. Structure of product's imports in value by countries, 2018-2024
-
7.2.4. Average price of product's imports, $ US/t
- 7.2.4.1. Annual dynamics of average price of product's imports to Antigua and Barbuda, 2018-2024, $ US/t
- 7.2.4.2. Dynamics of average price of product's imports to Antigua and Barbuda by countries, 2018-2024, $ US/t
-
7.1. Imports (Direct Data*)
-
8. Trade balance
-
8.1. Trade balance (Direct Data)
- 8.1.1. In kind, t
- 8.1.2. In value, K $ US
-
8.2. Trade balance (Mirror Data)
- 8.2.1. In kind, t
- 8.2.2. In value, K $ US
-
8.1. Trade balance (Direct Data)
-
9. Top buying and selling countries, 2018-2024
-
9.1. Direct Data
- 9.1.1. Import in Value by Countries-buyers
- 9.1.2. Export in Value by Countries-suppliers
-
9.2. Mirror Data
- 9.2.1. Import in Value by Countries-buyers
- 9.2.2. Export in Value by Countries-suppliers
-
9.1. Direct Data
Production watermelons in Caribbean
In kind, 2017-2020, K t
Top producers of watermelons, 2017-2020
World map of production of watermelons, 2017-2020
Caribbean watermelon production declined after two years of growth. In 2020, production was broadly stable year-over-year at 513.7 K t, compared to 516.5 K t in 2019, which marked the peak for the period. Between 2017 and 2020, production increased by 8.5%, equating to an annualized growth rate of 2.8%. The largest annual increase occurred in 2019, at 8.9%.
Annual dynamics of production in Caribbean in kind, 2017-2020, K t
| Parameter | 2018 | 2019 | 2020 | CAGR | |
|---|---|---|---|---|---|
| 1 | Change from last year | 0.2% | 8.9% | (0.5%) | 2.8% |
Exports watermelons from Caribbean
Exports in kind, t
Watermelon exports from the Caribbean showed volatility during the observed period. The peak was in 2017, while the trough occurred in 2018 at 181 t, with a 3.4-fold gap between these years. In 2020, exports rose to 608 t, up 56.3% from 2019. The largest decline was recorded in 2018 at 70.5%, and the largest increase was in 2019 at 115.4%.
Annual dynamics of product's exports from Caribbean in kind, 2017-2020, t
| Parameter | 2018 | 2019 | 2020 | CAGR | |
|---|---|---|---|---|---|
| 1 | Change from last year | (70.5%) | 115.4% | 56.3% | (0.3%) |
From 2017 to 2020, Caribbean watermelon exports in kind were highly diversified. The United States accounted for 12.2% of exports, France for 7.2%, and the Netherlands for 1.7%, together making up only 21.1% of total flows. The remaining 78.9% came from a long tail of smaller markets.
Structure of product's exports in kind by countries, 2017-2020
World map of product's exports from Caribbean in kind, 2017-2020
Exports in value, K $ US
Watermelon exports from the Caribbean declined for the third consecutive year. In 2020, exports amounted to 416 K $ US, down 25.4% year-over-year. Between 2017 and 2020, exports decreased by 51.6%, equating to an annualized decline of 21.5%.
Annual dynamics of product's exports from Caribbean in value, 2017-2020, K $ US
| Parameter | 2018 | 2019 | 2020 | CAGR | |
|---|---|---|---|---|---|
| 1 | Change from last year | (28.7%) | (9.1%) | (25.4%) | (21.5%) |
From 2017 to 2020, Caribbean watermelon exports in value terms were spread across many countries. The United States accounted for 10.8% of exports, France for 7.1%, and the Netherlands for 2.0%, jointly representing only 19.9% of total flows.
Structure of product's exports in value by countries, 2017-2020
World map of product's exports from Caribbean in value, 2017-2020
Imports watermelons to Caribbean
Imports in kind, t
Caribbean watermelon imports increased after a two-year contraction. In 2020, import volume reached 4 480 t, up 12.7% from the previous year. Between 2017 and 2020, imports decreased by 2.1%, equating to an annualized decline of 0.7%. The minimum value was recorded in 2019 at 3 973 t, with the largest decline that year at 10.2%.
Annual dynamics of product's imports to Caribbean in kind, 2017-2020, t
| Parameter | 2018 | 2019 | 2020 | CAGR | |
|---|---|---|---|---|---|
| 1 | Change from last year | (3.3%) | (10.2%) | 12.7% | (0.7%) |
From 2017 to 2020, the United States, Colombia, and Venezuela led as suppliers of watermelons to the Caribbean. The United States accounted for 48.9% of imports in kind, Colombia for 14.3%, and Venezuela for 11.2%, together taking 74.4% of total imports.
Structure of product's imports in kind by countries, 2017-2020
World map of product's imports to Caribbean in kind, 2017-2020
Imports in value, K $ US
Caribbean watermelon imports in value terms declined after two years of improvement. In 2020, import volume amounted to 4 507 K $ US, down 12.3% from the previous year. Between 2017 and 2020, imports increased by 4%, equating to an annualized growth rate of 1.3%. The maximum value was recorded in 2019 at 5 141 K $ US, and the largest increase occurred in 2018 at 17.4%.
Annual dynamics of product's imports to Caribbean in value, 2017-2020, K $ US
| Parameter | 2018 | 2019 | 2020 | CAGR | |
|---|---|---|---|---|---|
| 1 | Change from last year | 17.4% | 1.1% | (12.3%) | 1.3% |
Throughout 2017 to 2020, the United States, Colombia, and Guyana formed the core of Caribbean watermelon imports in value terms. The United States accounted for 65.0% of imports, Colombia for 9.9%, and Guyana for 5.3%, together taking 80.3% of total flows.
Structure of product's imports in value by countries, 2017-2020
World map of product's imports to Caribbean in value, 2017-2020
Related Reports

2026-03-28
Watermelons market in Suriname
2026-03-28
Watermelons market in Northern America
2026-03-28
Watermelons market in Northern Africa
2026-03-28

Cashew nuts market in Caribbean
2026-03-28


Melons and papayas market in Caribbean
2026-03-28

2026-03-28
Why Choose Us?
Only Verified Data
No Hidden Costs or Separate Fees
Smarter Subscription Pricing
Contact Our Team
Submit your inquiry using the form below — our team will get back to you within 24 hours.