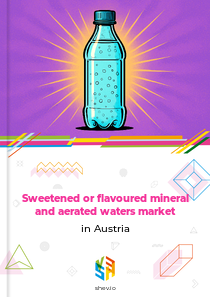







Earlier Report Observations
From 2018 to 2020, the market volume for sweetened or flavoured mineral and aerated waters in Austria grew from 1 494 million liters to 1 690 million liters. This steady increase was supported by consumer demand for high-quality, natural, and regional brands, with a clear trend towards bio-mineral water and flavored varieties.
The market expanded sharply to 4 919 million liters by 2023. This growth was driven by rising sales where the still water variant increased its share to 28% of total sales, attracting new consumption, and by the growing share of returnable packaging, which aligned with sustainability trends and a new deposit regulation announced for 2025.
In 2024, consumer preferences continued to favor carbonated water but with growing importance of still varieties, while packaging preferences stabilized with a rising returnable share of 20.5%. The market was further shaped by consumers seeking sustainable and healthy products, willing to pay higher prices, and by the unique regulatory status of mineral water as the only food product officially tested and approved by the Austrian Ministry of Health.
Table of content
- 1. Disclaimer
- 2. Terms of use of the report
- 3. Product codes in the statistical classifications used in the report
-
4. Key Market Indicators
-
4.1. In kind
- 4.1.1. Production, 2018-2020, 2023
- 4.1.2. Imports, 2018-2024
- 4.1.3. Exports, 2018-2024
- 4.1.4. Market size, 2018-2020, 2023
-
4.2. In value
- 4.2.1. Production, 2018-2020, 2023
- 4.2.2. Imports, 2018-2024
- 4.2.3. Exports, 2018-2024
- 4.2.4. Market size, 2018-2020, 2023
-
4.1. In kind
-
5. Production
-
5.1. Production in Austria
- 5.1.1. In kind, 2018-2020, 2023, M l
- 5.1.2. In value, 2018-2020, 2023, M $ US
-
5.2. Production in the EU, 2018-2024
- 5.2.1. In kind, 2018-2024, M l
- 5.2.2. In value, 2018-2024, M $ US
-
5.1. Production in Austria
-
6. Exports
-
6.1. Exports (Direct Data)
- 6.1.1. Exports - Total information
-
6.1.2. Exports in kind, M l
- 6.1.2.1. Annual dynamics of product's exports from Austria in kind, 2018-2024, M l
- 6.1.2.2. Dynamics of product's exports in kind from Austria by countries, 2018-2024, M l
- 6.1.2.3. Structure of product's exports in kind by countries, 2018-2024
-
6.1.3. Exports in value, M $ US
- 6.1.3.1. Annual dynamics of product's exports from Austria in value, 2018-2024, M $ US
- 6.1.3.2. Dynamics of product's exports in value from Austria by countries, 2018-2024, M $ US
- 6.1.3.3. Structure of product's exports in value by countries, 2018-2024
-
6.1.4. Average price of product's exports, $ US/K l
- 6.1.4.1. Annual dynamics of average price of product's exports from Austria, 2018-2024, $ US/K l
- 6.1.4.2. Dynamics of average price of product's exports from Austria by countries, 2018-2024, $ US/K l
-
6.2. Exports (Mirror Data)
- 6.2.1. Exports - Total information
-
6.2.2. Exports in kind, M l
- 6.2.2.1. Annual dynamics of product's exports from Austria in kind, 2018-2024, M l
- 6.2.2.2. Dynamics of product's exports in kind from Austria by countries, 2018-2024, M l
- 6.2.2.3. Structure of product's exports in kind by countries, 2018-2024
-
6.2.3. Exports in value, M $ US
- 6.2.3.1. Annual dynamics of product's exports from Austria in value, 2018-2024, M $ US
- 6.2.3.2. Dynamics of product's exports in value from Austria by countries, 2018-2024, M $ US
- 6.2.3.3. Structure of product's exports in value by countries, 2018-2024
-
6.2.4. Average price of product's exports, $ US/K l
- 6.2.4.1. Annual dynamics of average price of product's exports from Austria, 2018-2024, $ US/K l
- 6.2.4.2. Dynamics of average price of product's exports from Austria by countries, 2018-2024, $ US/K l
-
6.1. Exports (Direct Data)
-
7. Imports
-
7.1. Imports (Direct Data)
- 7.1.1. Imports - Total information
-
7.1.2. Imports in kind, M l
- 7.1.2.1. Annual dynamics of product's imports to Austria in kind, 2018-2024, M l
- 7.1.2.2. Dynamics of product's imports in kind to Austria by countries, 2018-2024, M l
- 7.1.2.3. Structure of product's imports in kind by countries, 2018-2024
-
7.1.3. Imports in value, M $ US
- 7.1.3.1. Annual dynamics of product's imports to Austria in value, 2018-2024, M $ US
- 7.1.3.2. Dynamics of product's imports in value to Austria by countries, 2018-2024, M $ US
- 7.1.3.3. Structure of product's imports in value by countries, 2018-2024
-
7.1.4. Average price of product's imports, $ US/K l
- 7.1.4.1. Annual dynamics of average price of product's imports to Austria, 2018-2024, $ US/K l
- 7.1.4.2. Dynamics of average price of product's imports to Austria by countries, 2018-2024, $ US/K l
-
7.2. Imports (Mirror Data)
- 7.2.1. Imports - Total information
-
7.2.2. Imports in kind, M l
- 7.2.2.1. Annual dynamics of product's imports to Austria in kind, 2018-2024, M l
- 7.2.2.2. Dynamics of product's imports in kind to Austria by countries, 2018-2024, M l
- 7.2.2.3. Structure of product's imports in kind by countries, 2018-2024
-
7.2.3. Imports in value, M $ US
- 7.2.3.1. Annual dynamics of product's imports to Austria in value, 2018-2024, M $ US
- 7.2.3.2. Dynamics of product's imports in value to Austria by countries, 2018-2024, M $ US
- 7.2.3.3. Structure of product's imports in value by countries, 2018-2024
-
7.2.4. Average price of product's imports, $ US/K l
- 7.2.4.1. Annual dynamics of average price of product's imports to Austria, 2018-2024, $ US/K l
- 7.2.4.2. Dynamics of average price of product's imports to Austria by countries, 2018-2024, $ US/K l
-
7.1. Imports (Direct Data)
-
8. Trade balance
-
8.1. Trade balance (Direct Data)
- 8.1.1. In kind, M l
- 8.1.2. In value, M $ US
-
8.2. Trade balance (Mirror Data)
- 8.2.1. In kind, M l
- 8.2.2. In value, M $ US
-
8.1. Trade balance (Direct Data)
-
9. Top buying and selling countries, 2018-2024
-
9.1. Direct Data
- 9.1.1. Import in Value by Countries-buyers
- 9.1.2. Export in Value by Countries-suppliers
-
9.2. Mirror Data
- 9.2.1. Import in Value by Countries-buyers
- 9.2.2. Export in Value by Countries-suppliers
-
9.1. Direct Data
Production sweetened or flavoured mineral and aerated waters in Austria
In value, 2017-2020, M $ US
Austria's production of sweetened or flavoured mineral and aerated waters has increased for the third consecutive year. In 2020, output was valued at 5 182 million US dollars, marking a measured increase of 3.6% compared to the previous year. Between 2017 and 2020, production grew by 20.8%, which equates to an annualized rate of 6.5%.
Annual dynamics of production in Austria in value, 2017-2020, M $ US
| Parameter | 2018 | 2019 | 2020 | CAGR | |
|---|---|---|---|---|---|
| 1 | Change from last year | 9.3% | 6.6% | 3.6% | 6.5% |
In kind, 2017-2020, M l
Austria's production of sweetened or flavoured mineral and aerated waters has increased for the third consecutive year. In 2020, 2 865 million litres were produced, up by 1.9% compared to 2019. Over the period from 2017 to 2020, production increased by 20.5%, with a compound annual growth rate (CAGR) of 6.4%.
Annual dynamics of production in Austria in kind, 2017-2020, M l
| Parameter | 2018 | 2019 | 2020 | CAGR | |
|---|---|---|---|---|---|
| 1 | Change from last year | 8.5% | 9.0% | 1.9% | 6.4% |
Exports sweetened or flavoured mineral and aerated waters from Austria
Exports in kind, M l
Sweetened or flavoured mineral and aerated waters exports from Austria have increased for the third consecutive year. In 2020, Austria exported 1 352 million litres, showing little change from the previous year. Between 2017 and 2020, exports grew by 22.9%, equating to an annualized rate of 7.1%.
Annual dynamics of product's exports from Austria in kind, 2017-2020, M l
| Parameter | 2018 | 2019 | 2020 | CAGR | |
|---|---|---|---|---|---|
| 1 | Change from last year | 14.3% | 7.0% | 0.4% | 7.1% |
From 2017 to 2020, the United States (28.4% of exports in kind), Germany (18.0% of exports in kind), and Hungary (7.6% of exports in kind) were the top buyers of sweetened or flavoured mineral and aerated waters from Austria. Their combined share reached 54.0% of total exports in kind.
Structure of product's exports in kind by countries, 2017-2020
World map of product's exports from Austria in kind, 2017-2020
Exports in value, M $ US
Sweetened or flavoured mineral and aerated waters exports from Austria have increased for the third consecutive year. In 2020, exports totalled 2 347 million US dollars, marking a controlled uptick of 5.2% versus the previous year. Over the period from 2017 to 2020, exports increased by 26.6%, with a compound annual growth rate (CAGR) of 8.2%.
Annual dynamics of product's exports from Austria in value, 2017-2020, M $ US
| Parameter | 2018 | 2019 | 2020 | CAGR | |
|---|---|---|---|---|---|
| 1 | Change from last year | 14.9% | 4.8% | 5.2% | 8.2% |
From 2017 to 2020, the leading destinations for exports in value terms were the United States (47.9% of exports in value terms), Germany (15.9% of exports in value terms), and Brazil (2.6% of exports in value terms). Together, they accounted for 66.4% of total export flows.
Structure of product's exports in value by countries, 2017-2020
World map of product's exports from Austria in value, 2017-2020
Imports sweetened or flavoured mineral and aerated waters to Austria
Imports in kind, M l
After a two-year uptick, the volume of sweetened or flavoured mineral and aerated waters imports into Austria declined. In 2020, imports totalled 178 million litres, which is 7.7% lower compared to 2019. Between 2017 and 2020, imports increased by 13.7%, equating to an annualized rate of 4.4%. The maximum volume was recorded in 2019 at 192 million litres, with the largest increase occurring in 2018 at 11.3%.
Annual dynamics of product's imports to Austria in kind, 2017-2020, M l
| Parameter | 2018 | 2019 | 2020 | CAGR | |
|---|---|---|---|---|---|
| 1 | Change from last year | 11.3% | 10.8% | (7.7%) | 4.4% |
Throughout 2017 to 2020, Germany (30.2% of imports in kind), Switzerland (24.9% of imports in kind), and Hungary (17.6% of imports in kind) formed the core group of markets for imports in kind. Together, they represented 72.7% of total import flows.
Structure of product's imports in kind by countries, 2017-2020
World map of product's imports to Austria in kind, 2017-2020
Imports in value, M $ US
Sweetened or flavoured mineral and aerated waters imports into Austria have increased for the third consecutive year. In 2020, import volume stood at 201 million US dollars, marking a slight rise of 0.6% year-over-year. Over the period from 2017 to 2020, imports increased by 49.2%, with a compound annual growth rate (CAGR) of 14.3%.
Annual dynamics of product's imports to Austria in value, 2017-2020, M $ US
| Parameter | 2018 | 2019 | 2020 | CAGR | |
|---|---|---|---|---|---|
| 1 | Change from last year | 20.7% | 22.9% | 0.6% | 14.3% |
From 2017 to 2020, the leading destinations for imports in value terms were Switzerland (42.5% of imports in value terms), Germany (25.0% of imports in value terms), and Hungary (9.6% of imports in value terms). Together, they accounted for 77.1% of total import flows.
Structure of product's imports in value by countries, 2017-2020
World map of product's imports to Austria in value, 2017-2020
Related Reports


Grape wine spirits market in Austria
2026-03-29
Non-alcoholic beer market in Austria
2026-03-29
2026-03-29
Why Choose Us?
Only Verified Data
No Hidden Costs or Separate Fees
Smarter Subscription Pricing
Contact Our Team
Submit your inquiry using the form below — our team will get back to you within 24 hours.