






"Caribbean" region includes following countries:
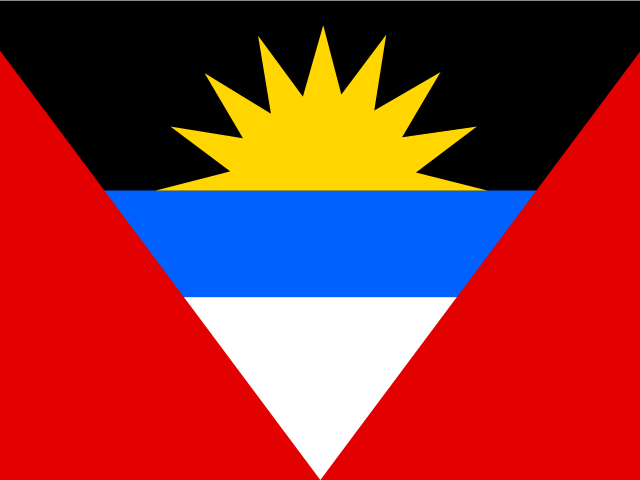 Antigua and Barbuda
 the Bahamas
 Barbados
 British Virgin Islands
 Cayman Islands
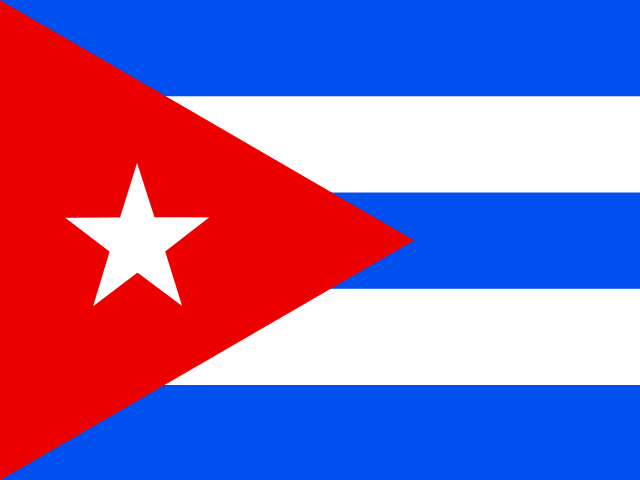 Cuba
Cuba Dominica
 Dominican Republic
 Grenada
 Guadeloupe
 Haiti
Haiti Jamaica
 Martinique
 Montserrat
 Curacao
 Aruba
Aruba Saint Maarten (Dutch part)
 Bonaire
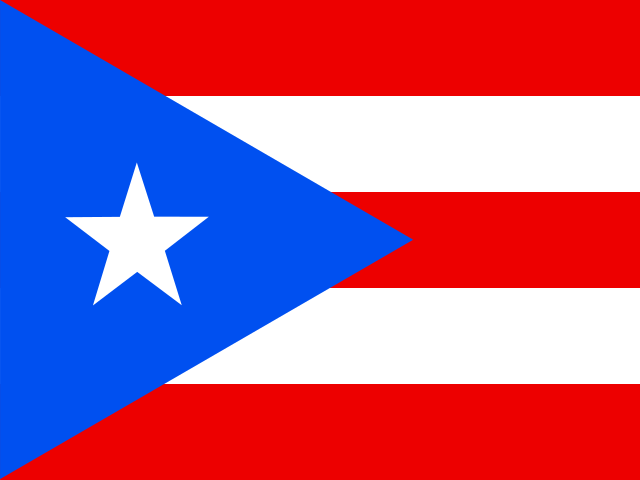 Puerto Rico
 Saint Kitts and Nevis
 Anguilla
 Saint Lucia
 Saint-Martin (French Part)
 Saint Vincent and the Grenadines
 Trinidad and Tobago
 Turks and Caicos Islands
 United States Virgin Islands
Earlier Report Observations
Caribbean pork market volume experienced considerable volatility from 2018 to 2023. Starting at 433.3 thousand tonnes in 2018, it saw a slight dip the following year before a sharp contraction to 336.1 thousand tonnes in 2020. A strong recovery followed, lifting the market to 440.5 thousand tonnes in 2022, but another significant decline brought it down to 275.0 thousand tonnes in 2023.
Underlying these fluctuations, longer-term demand for pork in the region has been shaped by rising disposable incomes and a shift in consumer preferences toward fresh and minimally processed protein. Furthermore, growth in tourism and the food service industry has bolstered consumption of chilled and frozen pork due to its convenience and longer shelf life.
Table of content
- 1. Disclaimer
- 2. Terms of use of the report
- 3. Product codes in the statistical classifications used in the report
-
4. Key Market Indicators and Trends
-
4.1. Key Market Indicators
-
4.1.1. In kind
- 4.1.1.1. Production, 2018-2023
- 4.1.1.2. Imports, 2018-2024
- 4.1.1.3. Exports, 2018-2024
- 4.1.1.4. Market size, 2018-2023
-
4.1.1. In kind
- 4.2. Market Trends and Factors
-
4.1. Key Market Indicators
-
5. Production
-
5.1. Production in Caribbean
- 5.1.1. Annual dynamics of production in Caribbean in kind, 2018-2023, K t
-
5.2. Global production by Country, 2018-2023
- 5.2.1. Annual dynamics of production by macroregions in kind, 2018-2023, K t
- 5.2.2. Dynamics of production structure by macroregions in kind, 2018-2023
- 5.2.3. Annual dynamics of production by country in kind, 2018-2023, K t
- 5.2.4. Structure of production by countries in kind, 2018-2023
- 5.2.5. Dynamics of peoduction structure by countries in kind, 2018-2023
-
5.1. Production in Caribbean
-
6. Imports
-
6.1. Imports (Direct Data*)
- 6.1.1. Imports - Total information
-
6.1.2. Imports in kind, K t
- 6.1.2.1. Annual dynamics of product's imports to Antigua and Barbuda in kind, 2018-2024, K t
- 6.1.2.2. Dynamics of product's imports in kind to Antigua and Barbuda by countries, 2018-2024, K t
- 6.1.2.3. Structure of product's imports in kind by countries, 2018-2024
-
6.1.3. Imports in value, M $ US
- 6.1.3.1. Annual dynamics of product's imports to Antigua and Barbuda in value, 2018-2024, M $ US
- 6.1.3.2. Dynamics of product's imports in value to Antigua and Barbuda by countries, 2018-2024, M $ US
- 6.1.3.3. Structure of product's imports in value by countries, 2018-2024
-
6.1.4. Average price of product's imports, $ US/t
- 6.1.4.1. Annual dynamics of average price of product's imports to Antigua and Barbuda, 2018-2024, $ US/t
- 6.1.4.2. Dynamics of average price of product's imports to Antigua and Barbuda by countries, 2018-2024, $ US/t
-
6.2. Imports (Mirror Data)
- 6.2.1. Imports - Total information
-
6.2.2. Imports in kind, K t
- 6.2.2.1. Annual dynamics of product's imports to Antigua and Barbuda in kind, 2018-2024, K t
- 6.2.2.2. Dynamics of product's imports in kind to Antigua and Barbuda by countries, 2018-2024, K t
- 6.2.2.3. Structure of product's imports in kind by countries, 2018-2024
-
6.2.3. Imports in value, M $ US
- 6.2.3.1. Annual dynamics of product's imports to Antigua and Barbuda in value, 2018-2024, M $ US
- 6.2.3.2. Dynamics of product's imports in value to Antigua and Barbuda by countries, 2018-2024, M $ US
- 6.2.3.3. Structure of product's imports in value by countries, 2018-2024
-
6.2.4. Average price of product's imports, $ US/t
- 6.2.4.1. Annual dynamics of average price of product's imports to Antigua and Barbuda, 2018-2024, $ US/t
- 6.2.4.2. Dynamics of average price of product's imports to Antigua and Barbuda by countries, 2018-2024, $ US/t
-
6.1. Imports (Direct Data*)
-
7. Exports
-
7.1. Exports (Direct Data*)
- 7.1.1. Exports - Total information
-
7.1.2. Exports in kind, K t
- 7.1.2.1. Annual dynamics of product's exports from Antigua and Barbuda in kind, 2018-2024, K t
- 7.1.2.2. Dynamics of product's exports in kind from Antigua and Barbuda by countries, 2018-2024, K t
- 7.1.2.3. Structure of product's exports in kind by countries, 2018-2024
-
7.1.3. Exports in value, M $ US
- 7.1.3.1. Annual dynamics of product's exports from Antigua and Barbuda in value, 2018-2024, M $ US
- 7.1.3.2. Dynamics of product's exports in value from Antigua and Barbuda by countries, 2018-2024, M $ US
- 7.1.3.3. Structure of product's exports in value by countries, 2018-2024
-
7.1.4. Average price of product's exports, $ US/t
- 7.1.4.1. Annual dynamics of average price of product's exports from Antigua and Barbuda, 2018-2024, $ US/t
- 7.1.4.2. Dynamics of average price of product's exports from Antigua and Barbuda by countries, 2018-2024, $ US/t
-
7.2. Exports (Mirror Data)
- 7.2.1. Exports - Total information
-
7.2.2. Exports in kind, K t
- 7.2.2.1. Annual dynamics of product's exports from Antigua and Barbuda in kind, 2018-2024, K t
- 7.2.2.2. Dynamics of product's exports in kind from Antigua and Barbuda by countries, 2018-2024, K t
- 7.2.2.3. Structure of product's exports in kind by countries, 2018-2024
-
7.2.3. Exports in value, M $ US
- 7.2.3.1. Annual dynamics of product's exports from Antigua and Barbuda in value, 2018-2024, M $ US
- 7.2.3.2. Dynamics of product's exports in value from Antigua and Barbuda by countries, 2018-2024, M $ US
- 7.2.3.3. Structure of product's exports in value by countries, 2018-2024
-
7.2.4. Average price of product's exports, $ US/t
- 7.2.4.1. Annual dynamics of average price of product's exports from Antigua and Barbuda, 2018-2024, $ US/t
- 7.2.4.2. Dynamics of average price of product's exports from Antigua and Barbuda by countries, 2018-2024, $ US/t
-
7.1. Exports (Direct Data*)
-
8. Trade balance
-
8.1. Trade balance (Direct Data)
- 8.1.1. In kind, K t
- 8.1.2. In value, M $ US
-
8.2. Trade balance (Mirror Data)
- 8.2.1. In kind, K t
- 8.2.2. In value, M $ US
-
8.1. Trade balance (Direct Data)
-
9. Top buying and selling countries, 2018-2024
-
9.1. Direct Data
- 9.1.1. Import in Value by Countries-buyers
- 9.1.2. Export in Value by Countries-suppliers
-
9.2. Mirror Data
- 9.2.1. Import in Value by Countries-buyers
- 9.2.2. Export in Value by Countries-suppliers
-
9.1. Direct Data
Production pork in Caribbean
In kind, 2017-2020, K t
Top producers of pork, 2017-2020
World map of production of pork, 2017-2020
In 2020, Caribbean pork production reached 267.5 thousand tons, marking a significant 27.6% decline from the previous year. From 2017 to 2020, production fell by 27.1%, averaging an annual decrease of 10.0%. The peak production occurred in 2019 at 369.6 thousand tons, with the largest year-on-year increase that year at 0.8%.
Annual dynamics of production in Caribbean in kind, 2017-2020, K t
| Parameter | 2018 | 2019 | 2020 | CAGR | |
|---|---|---|---|---|---|
| 1 | Change from last year | (0.0%) | 0.8% | (27.6%) | (10.0%) |
Exports pork from Caribbean
Exports in kind, t
The market showed considerable volatility over the period. Export volumes peaked in 2017 and hit their lowest point in 2018, with an 11.9-fold difference between these extremes. In 2020, Caribbean exported 220 tons of pork, down 3.6% from 2019. The minimum export volume was recorded in 2018 at 138 tons, which saw the steepest decline of 91.6%. The most substantial increase occurred in 2019, rising by 65.2%.
Annual dynamics of product's exports from Caribbean in kind, 2017-2020, t
| Parameter | 2018 | 2019 | 2020 | CAGR | |
|---|---|---|---|---|---|
| 1 | Change from last year | (91.6%) | 65.2% | (3.6%) | (48.9%) |
From 2017 to 2020, the primary destinations for Caribbean pork exports in volume terms were Guyana (68.8% of exports), Bunkers (7.3%), and the United States (1.7%). Together, these three markets accounted for 77.7% of total export flows.
Structure of product's exports in kind by countries, 2017-2020
World map of product's exports from Caribbean in kind, 2017-2020
Exports in value, M $ US
In 2020, Caribbean's pork exports were valued at 0.8 million US dollars, a 3.7% decrease from the previous year. Over the 2017-2020 period, export value declined by 25.5%, with a compound annual growth rate (CAGR) of -9.3%. The lowest value was recorded in 2018 at 0.5 million US dollars, which experienced the largest drop of 51.0%. The most significant increase occurred in 2019, rising by 57.9%.
Annual dynamics of product's exports from Caribbean in value, 2017-2020, M $ US
| Parameter | 2018 | 2019 | 2020 | CAGR | |
|---|---|---|---|---|---|
| 1 | Change from last year | (51.0%) | 57.9% | (3.7%) | (9.3%) |
Between 2017 and 2020, key buyers of Caribbean pork in value terms included Bunkers (33.7% of exports), Guyana (5.8%), and the United States (4.4%). However, their combined share represented only 43.9% of total export value, with the remaining 56.1% spread across numerous other trading partners.
Structure of product's exports in value by countries, 2017-2020
World map of product's exports from Caribbean in value, 2017-2020
Imports pork to Caribbean
Imports in kind, t
In 2020, Caribbean imported 68 799 tons of pork, a 13.0% increase from the previous year. From 2017 to 2020, import volumes grew by 18.4%, with a CAGR of 5.8%. The largest decrease occurred in 2019, falling by 8.8%, while the most substantial increase was in 2018, rising by 15.0%.
Annual dynamics of product's imports to Caribbean in kind, 2017-2020, t
| Parameter | 2018 | 2019 | 2020 | CAGR | |
|---|---|---|---|---|---|
| 1 | Change from last year | 15.0% | (8.8%) | 13.0% | 5.8% |
During 2017-2020, the United States (68.0% of imports), Canada (11.1%), and Brazil (4.7%) formed the core sources for Caribbean pork imports in volume terms, collectively accounting for 83.9% of total import flows.
Structure of product's imports in kind by countries, 2017-2020
World map of product's imports to Caribbean in kind, 2017-2020
Imports in value, M $ US
In 2020, Caribbean's pork imports totaled 150.8 million US dollars, up 3.2% from 2019. Between 2017 and 2020, import value increased by 4.2%, averaging an annual growth rate of 1.4%. The highest value was recorded in 2018 at 157.0 million US dollars. The largest decline occurred in 2019, dropping by 6.9%, while the most significant increase was in 2018, rising by 8.4%.
Annual dynamics of product's imports to Caribbean in value, 2017-2020, M $ US
| Parameter | 2018 | 2019 | 2020 | CAGR | |
|---|---|---|---|---|---|
| 1 | Change from last year | 8.4% | (6.9%) | 3.2% | 1.4% |
From 2017 to 2020, the United States remained the dominant source of pork imports to Caribbean, accounting for 71.7% of total import value. The remainder was distributed among various other countries.
Structure of product's imports in value by countries, 2017-2020
World map of product's imports to Caribbean in value, 2017-2020
Related Reports

2026-03-27
2026-03-27
2026-03-27
2026-03-27

Chicken meat and offal market in Caribbean
2026-03-27


Poultry meat and offal market in Caribbean
2026-03-27

Turkey meat and offal market in Caribbean
2026-03-27
Why Choose Us?
Only Verified Data
No Hidden Costs or Separate Fees
Smarter Subscription Pricing
Contact Our Team
Submit your inquiry using the form below — our team will get back to you within 24 hours.