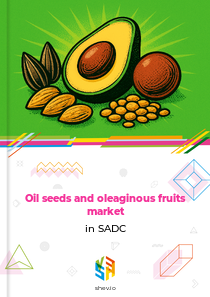







"SADC" region includes following countries:
 Angola
 Botswana
 Comoros
 Democratic Republic of the Congo
 Eswatini
 Lesotho
 Madagascar
 Malawi
 Mauritius
 Mozambique
 Namibia
 Seychelles
 South Africa
 Tanzania
 Zambia
 Zimbabwe
Earlier Report Observations
The market volume for oil seeds and oleaginous fruits in SADC grew from 166.6 thousand tons in 2018 to 171.1 thousand tons in 2020. This increase was driven by higher domestic production, as outputs of soybeans, sunflower seeds, and groundnuts rose due to favorable growing conditions. A weaker domestic currency and elevated international prices, particularly for sunflower seed following production challenges in the Black Sea region, further incentivized local cultivation and supported market expansion.
Market volume experienced a minor contraction to 171.0 thousand tons in 2021 before climbing to 173.7 thousand tons by 2023. Global supply disruptions, including reduced sunflower seed harvests in Ukraine and lower rapeseed production in the EU, maintained high international prices and encouraged continued local output. The growth was also aided by increased domestic crushing capacity for sunflower seeds, which reduced import dependence, while the concentrated processing sector captured wider margins during periods of inflation.
Table of content
- 1. Disclaimer
- 2. Terms of use of the report
- 3. Product codes in the statistical classifications used in the report
-
4. Key Market Indicators and Trends
-
4.1. Key Market Indicators
-
4.1.1. In kind
- 4.1.1.1. Production, 2018-2023
- 4.1.1.2. Imports, 2018-2024
- 4.1.1.3. Exports, 2018-2024
- 4.1.1.4. Market size, 2018-2023
-
4.1.1. In kind
- 4.2. Market Trends and Factors
-
4.1. Key Market Indicators
-
5. Production
-
5.1. Production in SADC
- 5.1.1. Annual dynamics of production in SADC in kind, 2018-2023, K t
-
5.2. Global production by Country, 2018-2023
- 5.2.1. Annual dynamics of production by macroregions in kind, 2018-2023, K t
- 5.2.2. Dynamics of production structure by macroregions in kind, 2018-2023
- 5.2.3. Annual dynamics of production by country in kind, 2018-2023, K t
- 5.2.4. Structure of production by countries in kind, 2018-2023
- 5.2.5. Dynamics of peoduction structure by countries in kind, 2018-2023
-
5.1. Production in SADC
-
6. Imports
-
6.1. Imports (Direct Data*)
- 6.1.1. Imports - Total information
-
6.1.2. Imports in kind, t
- 6.1.2.1. Annual dynamics of product's imports to Angola in kind, 2018-2024, t
- 6.1.2.2. Dynamics of product's imports in kind to Angola by countries, 2018-2024, t
- 6.1.2.3. Structure of product's imports in kind by countries, 2018-2024
-
6.1.3. Imports in value, K $ US
- 6.1.3.1. Annual dynamics of product's imports to Angola in value, 2018-2024, K $ US
- 6.1.3.2. Dynamics of product's imports in value to Angola by countries, 2018-2024, K $ US
- 6.1.3.3. Structure of product's imports in value by countries, 2018-2024
-
6.1.4. Average price of product's imports, $ US/kg
- 6.1.4.1. Annual dynamics of average price of product's imports to Angola, 2018-2024, $ US/kg
- 6.1.4.2. Dynamics of average price of product's imports to Angola by countries, 2018-2024, $ US/kg
-
6.2. Imports (Mirror Data)
- 6.2.1. Imports - Total information
-
6.2.2. Imports in kind, t
- 6.2.2.1. Annual dynamics of product's imports to Angola in kind, 2018-2024, t
- 6.2.2.2. Dynamics of product's imports in kind to Angola by countries, 2018-2024, t
- 6.2.2.3. Structure of product's imports in kind by countries, 2018-2024
-
6.2.3. Imports in value, K $ US
- 6.2.3.1. Annual dynamics of product's imports to Angola in value, 2018-2024, K $ US
- 6.2.3.2. Dynamics of product's imports in value to Angola by countries, 2018-2024, K $ US
- 6.2.3.3. Structure of product's imports in value by countries, 2018-2024
-
6.2.4. Average price of product's imports, $ US/kg
- 6.2.4.1. Annual dynamics of average price of product's imports to Angola, 2018-2024, $ US/kg
- 6.2.4.2. Dynamics of average price of product's imports to Angola by countries, 2018-2024, $ US/kg
-
6.1. Imports (Direct Data*)
-
7. Exports
-
7.1. Exports (Direct Data*)
- 7.1.1. Exports - Total information
-
7.1.2. Exports in kind, t
- 7.1.2.1. Annual dynamics of product's exports from Angola in kind, 2018-2024, t
- 7.1.2.2. Dynamics of product's exports in kind from Angola by countries, 2018-2024, t
- 7.1.2.3. Structure of product's exports in kind by countries, 2018-2024
-
7.1.3. Exports in value, K $ US
- 7.1.3.1. Annual dynamics of product's exports from Angola in value, 2018-2024, K $ US
- 7.1.3.2. Dynamics of product's exports in value from Angola by countries, 2018-2024, K $ US
- 7.1.3.3. Structure of product's exports in value by countries, 2018-2024
-
7.1.4. Average price of product's exports, $ US/kg
- 7.1.4.1. Annual dynamics of average price of product's exports from Angola, 2018-2024, $ US/kg
- 7.1.4.2. Dynamics of average price of product's exports from Angola by countries, 2018-2024, $ US/kg
-
7.2. Exports (Mirror Data)
- 7.2.1. Exports - Total information
-
7.2.2. Exports in kind, t
- 7.2.2.1. Annual dynamics of product's exports from Angola in kind, 2018-2024, t
- 7.2.2.2. Dynamics of product's exports in kind from Angola by countries, 2018-2024, t
- 7.2.2.3. Structure of product's exports in kind by countries, 2018-2024
-
7.2.3. Exports in value, K $ US
- 7.2.3.1. Annual dynamics of product's exports from Angola in value, 2018-2024, K $ US
- 7.2.3.2. Dynamics of product's exports in value from Angola by countries, 2018-2024, K $ US
- 7.2.3.3. Structure of product's exports in value by countries, 2018-2024
-
7.2.4. Average price of product's exports, $ US/kg
- 7.2.4.1. Annual dynamics of average price of product's exports from Angola, 2018-2024, $ US/kg
- 7.2.4.2. Dynamics of average price of product's exports from Angola by countries, 2018-2024, $ US/kg
-
7.1. Exports (Direct Data*)
-
8. Trade balance
-
8.1. Trade balance (Direct Data)
- 8.1.1. In kind, t
- 8.1.2. In value, K $ US
-
8.2. Trade balance (Mirror Data)
- 8.2.1. In kind, t
- 8.2.2. In value, K $ US
-
8.1. Trade balance (Direct Data)
-
9. Top buying and selling countries, 2018-2024
-
9.1. Direct Data
- 9.1.1. Import in Value by Countries-buyers
- 9.1.2. Export in Value by Countries-suppliers
-
9.2. Mirror Data
- 9.2.1. Import in Value by Countries-buyers
- 9.2.2. Export in Value by Countries-suppliers
-
9.1. Direct Data
Production oil seeds and oleaginous fruits in SADC
In kind, 2017-2020, K t
Top producers of oil seeds and oleaginous fruits, 2017-2020
World map of production of oil seeds and oleaginous fruits, 2017-2020
SADC's production of oil seeds and oleaginous fruits has grown for the third year in a row. In 2020, the region produced 171.6 thousand tonnes, marking a modest 2.7% increase from 2019. Looking at the period from 2017 to 2020, overall production rose by 4.8%, which translates to an average annual growth rate of 1.6%.
Annual dynamics of production in SADC in kind, 2017-2020, K t
| Parameter | 2018 | 2019 | 2020 | CAGR | |
|---|---|---|---|---|---|
| 1 | Change from last year | 1.1% | 1.0% | 2.7% | 1.6% |
Exports oil seeds and oleaginous fruits from SADC
Exports in kind, t
The market for exports in kind experienced significant fluctuations during this period. Volumes hit their lowest point in 2018 at 493 tonnes, then peaked in 2017, with the difference between these years being 7.6 times. In 2020, SADC exported 1 475 tonnes of oil seeds and oleaginous fruits, a substantial 76.2% jump compared to 2019. The sharpest decline occurred in 2018, dropping by 86.8%.
Annual dynamics of product's exports from SADC in kind, 2017-2020, t
| Parameter | 2018 | 2019 | 2020 | CAGR | |
|---|---|---|---|---|---|
| 1 | Change from last year | (86.8%) | 69.9% | 76.2% | (26.6%) |
From 2017 to 2020, China, Japan, and Turkey were the leading destinations for exports in kind, contributing 34.6%, 20.3%, and 10.6% respectively. Together, these three countries accounted for 65.6% of total export volumes.
Structure of product's exports in kind by countries, 2017-2020
World map of product's exports from SADC in kind, 2017-2020
Exports in value, K $ US
Exports of oil seeds and oleaginous fruits from SADC in value terms have fallen for the third consecutive year. In 2020, exports totaled 808 thousand US dollars, down 0.8% from the previous year. Over the 2017–2020 period, export value plummeted by 81.9%, averaging an annual decline of 43.4%.
Annual dynamics of product's exports from SADC in value, 2017-2020, K $ US
| Parameter | 2018 | 2019 | 2020 | CAGR | |
|---|---|---|---|---|---|
| 1 | Change from last year | (72.3%) | (34.1%) | (0.8%) | (43.4%) |
Between 2017 and 2020, the main buyers by value were China, Japan, and Vietnam, accounting for 27.7%, 23.8%, and 9.5% of exports respectively. Combined, these three markets made up 61.1% of total export value.
Structure of product's exports in value by countries, 2017-2020
World map of product's exports from SADC in value, 2017-2020
Imports oil seeds and oleaginous fruits to SADC
Imports in kind, t
Imports of oil seeds and oleaginous fruits into SADC in kind have decreased for the second year running. In 2020, imports stood at 996 tonnes, a significant 22.2% drop from 2019. The highest volume was recorded in 2018 at 1 576 tonnes, which also saw the largest increase of 60.6%.
Annual dynamics of product's imports to SADC in kind, 2017-2020, t
| Parameter | 2018 | 2019 | 2020 | CAGR | |
|---|---|---|---|---|---|
| 1 | Change from last year | 60.6% | (18.7%) | (22.2%) | 0.5% |
The import market in kind from 2017 to 2020 was diverse, with China, the United States, and the Netherlands as the top sources, contributing 23.5%, 8.7%, and 7.6% respectively. Together, they represented just 39.8% of total imports, while the remaining 60.2% came from a wide range of other countries.
Structure of product's imports in kind by countries, 2017-2020
World map of product's imports to SADC in kind, 2017-2020
Imports in value, K $ US
The import market in value terms showed volatility over the observed period. The lowest point was in 2017, followed by a peak in 2018, with a 1.7-fold difference between these years. In 2020, imports amounted to 2 719 thousand US dollars, a solid 24.0% decrease year-over-year. The maximum value was in 2018 at 3 746 thousand US dollars, which also experienced the largest increase of 73.8%.
Annual dynamics of product's imports to SADC in value, 2017-2020, K $ US
| Parameter | 2018 | 2019 | 2020 | CAGR | |
|---|---|---|---|---|---|
| 1 | Change from last year | 73.8% | (4.5%) | (24.0%) | 8.1% |
From 2017 to 2020, the partner landscape for imports in value terms was broad. China, the Netherlands, and Argentina were the leading sources, accounting for 29.4%, 10.7%, and 6.3% respectively. Together, they formed only 46.4% of total import value, with the substantial remaining 53.6% supplied by numerous other countries.
Structure of product's imports in value by countries, 2017-2020
World map of product's imports to SADC in value, 2017-2020
Related Reports


2026-03-28

Primary sugar crops market in SADC
2026-03-30
2026-03-29

Palm nuts and kernels market in SADC
2026-03-28
Why Choose Us?
Only Verified Data
No Hidden Costs or Separate Fees
Smarter Subscription Pricing
Contact Our Team
Submit your inquiry using the form below — our team will get back to you within 24 hours.