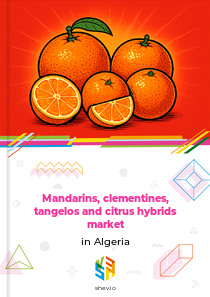







Earlier Report Observations
Algeria's production of mandarins, clementines, tangelos, and citrus hybrids increased from 262.8 thousand tons in 2018 to 302.5 thousand tons in 2020. This expansion was supported by a long-established citrus sector spanning over 70 thousand hectares, backed by state efforts that sustained more than 250 000 jobs. The continued planting of clementine orchards in provinces such as Blida and El Tarf, with trees reaching full bearing capacity within four years, directly added productive area and boosted output.
Following a contraction to 290.4 thousand tons in 2021, production recovered to 297.5 thousand tons in 2022 and rose further to 317.4 thousand tons in 2023. The total market volume reached 321.1 thousand tons in 2023, marked by the first significant imports of 3.8 thousand tons. During these years, Algerian growers navigated challenges from rising global mandarin acreage and shifting consumer demand, which influenced market dynamics and quality expectations.
Table of content
- 1. Disclaimer
- 2. Terms of use of the report
- 3. Product codes in the statistical classifications used in the report
-
4. Key Market Indicators and Trends
-
4.1. Key Market Indicators
-
4.1.1. In kind
- 4.1.1.1. Production, 2018-2023
- 4.1.1.2. Imports, 2018-2024
- 4.1.1.3. Exports, 2018-2024
- 4.1.1.4. Market size, 2018-2023
-
4.1.1. In kind
- 4.2. Market Trends and Factors
-
4.1. Key Market Indicators
-
5. Production
-
5.1. Production in Algeria
- 5.1.1. Annual dynamics of production in Algeria in kind, 2018-2023, K t
- 5.1.2. Annual dynamics of production in Algeria in value, 2018-2023, $ US
-
5.2. Global production by Country, 2018-2023
- 5.2.1. Annual dynamics of production by macroregions in kind, 2018-2023, K t
- 5.2.2. Dynamics of production structure by macroregions in kind, 2018-2023
- 5.2.3. Annual dynamics of production by country in kind, 2018-2023, K t
- 5.2.4. Structure of production by countries in kind, 2018-2023
- 5.2.5. Dynamics of peoduction structure by countries in kind, 2018-2023
-
5.1. Production in Algeria
-
6. Exports
-
6.1. Exports (Direct Data*)
- 6.1.1. Exports - Total information
-
6.1.2. Exports in kind, t
- 6.1.2.1. Annual dynamics of product's exports from Algeria in kind, 2018-2024, t
- 6.1.2.2. Dynamics of product's exports in kind from Algeria by countries, 2018-2024, t
- 6.1.2.3. Structure of product's exports in kind by countries, 2018-2024
-
6.1.3. Exports in value, K $ US
- 6.1.3.1. Annual dynamics of product's exports from Algeria in value, 2018-2024, K $ US
- 6.1.3.2. Dynamics of product's exports in value from Algeria by countries, 2018-2024, K $ US
- 6.1.3.3. Structure of product's exports in value by countries, 2018-2024
-
6.1.4. Average price of product's exports, $ US/t
- 6.1.4.1. Annual dynamics of average price of product's exports from Algeria, 2018-2024, $ US/t
- 6.1.4.2. Dynamics of average price of product's exports from Algeria by countries, 2018-2024, $ US/t
-
6.2. Exports (Mirror Data)
- 6.2.1. Exports - Total information
-
6.2.2. Exports in kind, t
- 6.2.2.1. Annual dynamics of product's exports from Algeria in kind, 2018-2024, t
- 6.2.2.2. Dynamics of product's exports in kind from Algeria by countries, 2018-2024, t
- 6.2.2.3. Structure of product's exports in kind by countries, 2018-2024
-
6.2.3. Exports in value, K $ US
- 6.2.3.1. Annual dynamics of product's exports from Algeria in value, 2018-2024, K $ US
- 6.2.3.2. Dynamics of product's exports in value from Algeria by countries, 2018-2024, K $ US
- 6.2.3.3. Structure of product's exports in value by countries, 2018-2024
-
6.2.4. Average price of product's exports, $ US/t
- 6.2.4.1. Annual dynamics of average price of product's exports from Algeria, 2018-2024, $ US/t
- 6.2.4.2. Dynamics of average price of product's exports from Algeria by countries, 2018-2024, $ US/t
-
6.1. Exports (Direct Data*)
-
7. Imports
-
7.1. Imports (Direct Data*)
- 7.1.1. Imports - Total information
-
7.1.2. Imports in kind, t
- 7.1.2.1. Annual dynamics of product's imports to Algeria in kind, 2018-2024, t
- 7.1.2.2. Dynamics of product's imports in kind to Algeria by countries, 2018-2024, t
- 7.1.2.3. Structure of product's imports in kind by countries, 2018-2024
-
7.1.3. Imports in value, K $ US
- 7.1.3.1. Annual dynamics of product's imports to Algeria in value, 2018-2024, K $ US
- 7.1.3.2. Dynamics of product's imports in value to Algeria by countries, 2018-2024, K $ US
- 7.1.3.3. Structure of product's imports in value by countries, 2018-2024
-
7.1.4. Average price of product's imports, $ US/t
- 7.1.4.1. Annual dynamics of average price of product's imports to Algeria, 2018-2024, $ US/t
- 7.1.4.2. Dynamics of average price of product's imports to Algeria by countries, 2018-2024, $ US/t
-
7.2. Imports (Mirror Data)
- 7.2.1. Imports - Total information
-
7.2.2. Imports in kind, t
- 7.2.2.1. Annual dynamics of product's imports to Algeria in kind, 2018-2024, t
- 7.2.2.2. Dynamics of product's imports in kind to Algeria by countries, 2018-2024, t
- 7.2.2.3. Structure of product's imports in kind by countries, 2018-2024
-
7.2.3. Imports in value, K $ US
- 7.2.3.1. Annual dynamics of product's imports to Algeria in value, 2018-2024, K $ US
- 7.2.3.2. Dynamics of product's imports in value to Algeria by countries, 2018-2024, K $ US
- 7.2.3.3. Structure of product's imports in value by countries, 2018-2024
-
7.2.4. Average price of product's imports, $ US/t
- 7.2.4.1. Annual dynamics of average price of product's imports to Algeria, 2018-2024, $ US/t
- 7.2.4.2. Dynamics of average price of product's imports to Algeria by countries, 2018-2024, $ US/t
-
7.1. Imports (Direct Data*)
-
8. Trade balance
-
8.1. Trade balance (Direct Data)
- 8.1.1. In kind, t
- 8.1.2. In value, K $ US
-
8.2. Trade balance (Mirror Data)
- 8.2.1. In kind, t
- 8.2.2. In value, K $ US
-
8.1. Trade balance (Direct Data)
-
9. Top buying and selling countries, 2018-2024
-
9.1. Direct Data
- 9.1.1. Import in Value by Countries-buyers
- 9.1.2. Export in Value by Countries-suppliers
-
9.2. Mirror Data
- 9.2.1. Import in Value by Countries-buyers
- 9.2.2. Export in Value by Countries-suppliers
-
9.1. Direct Data
Production mandarins, clementines, tangelos and citrus hybrids in Algeria
In kind, 2017-2020, K t
From 2017 to 2020, Algeria ranked 18th globally in the production of mandarins, clementines, tangelos, and citrus hybrids.
Top producers of mandarins, clementines, tangelos and citrus hybrids, 2017-2020
World map of production of mandarins, clementines, tangelos and citrus hybrids, 2017-2020
Algeria's production of mandarins, clementines, tangelos, and citrus hybrids grew for the third year in a row. In 2020, the country produced 302.5 K t, showing a modest year-on-year increase of 2.4%. Over the period from 2017 to 2020, production rose by 20.7%, which translates to an average annual growth rate of 6.5%.
Annual dynamics of production in Algeria in kind, 2017-2020, K t
| Parameter | 2018 | 2019 | 2020 | CAGR | |
|---|---|---|---|---|---|
| 1 | Change from last year | 4.8% | 12.4% | 2.4% | 6.5% |
Exports mandarins, clementines, tangelos and citrus hybrids from Algeria
Exports in kind, kg
The export market displayed volatility during the observed years. Exports hit their lowest point in 2017 and peaked in 2019, with a 3.6-fold difference between these two years. In 2020, Algeria's export volume of mandarins, clementines, tangelos, and citrus hybrids was 5 705 kg, marking a sharp decline of 69.3% compared to the previous year. The highest export volume was recorded in 2019 at 18 560 kg, while the largest year-on-year increase occurred in 2018, reaching 200.6%.
Annual dynamics of product's exports from Algeria in kind, 2017-2020, kg
| Parameter | 2018 | 2019 | 2020 | CAGR | |
|---|---|---|---|---|---|
| 1 | Change from last year | 200.6% | 19.4% | (69.3%) | 3.3% |
Between 2017 and 2020, Algeria's exports in kind were dominated by the United Arab Emirates and Canada, which together made up 80.1% of total shipments. Other markets contributed smaller shares, forming a long tail in the export structure.
Structure of product's exports in kind by countries, 2017-2020
World map of product's exports from Algeria in kind, 2017-2020
Exports in value, $ US
The data shows irregular fluctuations, pointing to a volatile market environment. Import values varied significantly, with a 5.3-fold difference between the high in 2018 and the low in 2020. In 2020, Algeria's cross-border shipments of mandarins, clementines, tangelos, and citrus hybrids amounted to 4 196 US dollars, reflecting a steep drop of 73.6% from 2019. The maximum value was achieved in 2018 at 22 137 US dollars, and the largest year-on-year increase also occurred in 2018, at 165.1%.
Annual dynamics of product's exports from Algeria in value, 2017-2020, $ US
| Parameter | 2018 | 2019 | 2020 | CAGR | |
|---|---|---|---|---|---|
| 1 | Change from last year | 165.1% | (28.2%) | (73.6%) | (20.5%) |
From 2017 to 2020, the largest buyers of mandarins, clementines, tangelos, and citrus hybrids from Algeria in value terms were the United Arab Emirates (47.3% of exports), Canada (31.9% of exports), and Qatar (7.9% of exports). Together, these three countries accounted for 87.0% of Algeria's total export value during this period.
Structure of product's exports in value by countries, 2017-2020
World map of product's exports from Algeria in value, 2017-2020
Imports mandarins, clementines, tangelos and citrus hybrids to Algeria
Imports in kind, kg
Annual dynamics of product's imports to Algeria in kind, 2017-2020, kg
| Parameter | 2018 | 2019 | 2020 | CAGR | |
|---|---|---|---|---|---|
| 1 | Change from last year | n/a | n/a | n/a | - |
Between 2017 and 2020, nearly all imports in kind of mandarins, clementines, tangelos, and citrus hybrids to Algeria came from Brazil, which held a 100.0% share of total flows.
Structure of product's imports in kind by countries, 2017-2020
World map of product's imports to Algeria in kind, 2017-2020
Imports in value, $ US
Annual dynamics of product's imports to Algeria in value, 2017-2020, $ US
| Parameter | 2018 | 2019 | 2020 | CAGR | |
|---|---|---|---|---|---|
| 1 | Change from last year | n/a | n/a | n/a | - |
From 2017 to 2020, Algeria's import dependence on Brazil was significant, with Brazil accounting for 100.0% of the total import value of mandarins, clementines, tangelos, and citrus hybrids.
Structure of product's imports in value by countries, 2017-2020
World map of product's imports to Algeria in value, 2017-2020
Related Reports
2026-03-28
2026-03-28

Lemons and limes market in Algeria
2026-03-28
Fresh grapes market in Algeria
2026-03-28
Why Choose Us?
Only Verified Data
No Hidden Costs or Separate Fees
Smarter Subscription Pricing
Contact Our Team
Submit your inquiry using the form below — our team will get back to you within 24 hours.