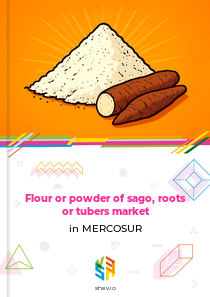







"MERCOSUR" region includes following countries:
 Brazil
 Argentina
 Uruguay
 Paraguay
Earlier Report Observations
The market volume for flour or powder of sago, roots or tubers in MERCOSUR fluctuated moderately between 2018 and 2023, starting at 979 thousand tons and ending at 989 thousand tons. It reached a peak of 993 thousand tons in 2020, followed by a slight contraction to 952 thousand tons in 2022, before recovering nearly to its initial level the following year.
Brazil's role as a significant exporter within the trade bloc influenced regional supply dynamics throughout the period. The country's export activity, particularly in cassava-based flours, remained a constant feature of the market structure.
Overall, the market demonstrated relative stability, with annual changes generally staying within a narrow band. The most notable shift was the 2022 dip, which was followed by a clear rebound, suggesting underlying demand resilience.
Table of content
- 1. Disclaimer
- 2. Terms of use of the report
- 3. Product codes in the statistical classifications used in the report
-
4. Key Market Indicators and Trends
-
4.1. Key Market Indicators
-
4.1.1. In kind
- 4.1.1.1. Production, 2018-2023
- 4.1.1.2. Imports, 2018-2024
- 4.1.1.3. Exports, 2018-2024
- 4.1.1.4. Market size, 2018-2023
-
4.1.2. In value
- 4.1.2.1. Production, 2018-2023
- 4.1.2.2. Imports, 2018-2024
- 4.1.2.3. Exports, 2018-2024
- 4.1.2.4. Market size, 2018-2023
-
4.1.1. In kind
- 4.2. Market Trends and Factors
-
4.1. Key Market Indicators
-
5. Production
-
5.1. Production in MERCOSUR
- 5.1.1. Annual dynamics of production in MERCOSUR in kind, 2018-2023, K t
-
5.2. Global production by Country, 2018-2023
- 5.2.1. Annual dynamics of production by macroregions in kind, 2018-2023, K t
- 5.2.2. Dynamics of production structure by macroregions in kind, 2018-2023
- 5.2.3. Annual dynamics of production by country in kind, 2018-2023, K t
- 5.2.4. Structure of production by countries in kind, 2018-2023
- 5.2.5. Dynamics of peoduction structure by countries in kind, 2018-2023
-
5.1. Production in MERCOSUR
-
6. Imports
-
6.1. Imports (Direct Data)
- 6.1.1. Imports - Total information
-
6.1.2. Imports in kind, t
- 6.1.2.1. Annual dynamics of product's imports to Brazil in kind, 2018-2024, t
- 6.1.2.2. Dynamics of product's imports in kind to Brazil by countries, 2018-2024, t
- 6.1.2.3. Structure of product's imports in kind by countries, 2018-2024
-
6.1.3. Imports in value, K $ US
- 6.1.3.1. Annual dynamics of product's imports to Brazil in value, 2018-2024, K $ US
- 6.1.3.2. Dynamics of product's imports in value to Brazil by countries, 2018-2024, K $ US
- 6.1.3.3. Structure of product's imports in value by countries, 2018-2024
-
6.1.4. Average price of product's imports, $ US/t
- 6.1.4.1. Annual dynamics of average price of product's imports to Brazil, 2018-2024, $ US/t
- 6.1.4.2. Dynamics of average price of product's imports to Brazil by countries, 2018-2024, $ US/t
-
6.2. Imports (Mirror Data)
- 6.2.1. Imports - Total information
-
6.2.2. Imports in kind, t
- 6.2.2.1. Annual dynamics of product's imports to Brazil in kind, 2018-2024, t
- 6.2.2.2. Dynamics of product's imports in kind to Brazil by countries, 2018-2024, t
- 6.2.2.3. Structure of product's imports in kind by countries, 2018-2024
-
6.2.3. Imports in value, K $ US
- 6.2.3.1. Annual dynamics of product's imports to Brazil in value, 2018-2024, K $ US
- 6.2.3.2. Dynamics of product's imports in value to Brazil by countries, 2018-2024, K $ US
- 6.2.3.3. Structure of product's imports in value by countries, 2018-2024
-
6.2.4. Average price of product's imports, $ US/t
- 6.2.4.1. Annual dynamics of average price of product's imports to Brazil, 2018-2024, $ US/t
- 6.2.4.2. Dynamics of average price of product's imports to Brazil by countries, 2018-2024, $ US/t
-
6.1. Imports (Direct Data)
-
7. Exports
-
7.1. Exports (Direct Data)
- 7.1.1. Exports - Total information
-
7.1.2. Exports in kind, t
- 7.1.2.1. Annual dynamics of product's exports from Brazil in kind, 2018-2024, t
- 7.1.2.2. Dynamics of product's exports in kind from Brazil by countries, 2018-2024, t
- 7.1.2.3. Structure of product's exports in kind by countries, 2018-2024
-
7.1.3. Exports in value, K $ US
- 7.1.3.1. Annual dynamics of product's exports from Brazil in value, 2018-2024, K $ US
- 7.1.3.2. Dynamics of product's exports in value from Brazil by countries, 2018-2024, K $ US
- 7.1.3.3. Structure of product's exports in value by countries, 2018-2024
-
7.1.4. Average price of product's exports, $ US/t
- 7.1.4.1. Annual dynamics of average price of product's exports from Brazil, 2018-2024, $ US/t
- 7.1.4.2. Dynamics of average price of product's exports from Brazil by countries, 2018-2024, $ US/t
-
7.2. Exports (Mirror Data)
- 7.2.1. Exports - Total information
-
7.2.2. Exports in kind, t
- 7.2.2.1. Annual dynamics of product's exports from Brazil in kind, 2018-2024, t
- 7.2.2.2. Dynamics of product's exports in kind from Brazil by countries, 2018-2024, t
- 7.2.2.3. Structure of product's exports in kind by countries, 2018-2024
-
7.2.3. Exports in value, K $ US
- 7.2.3.1. Annual dynamics of product's exports from Brazil in value, 2018-2024, K $ US
- 7.2.3.2. Dynamics of product's exports in value from Brazil by countries, 2018-2024, K $ US
- 7.2.3.3. Structure of product's exports in value by countries, 2018-2024
-
7.2.4. Average price of product's exports, $ US/t
- 7.2.4.1. Annual dynamics of average price of product's exports from Brazil, 2018-2024, $ US/t
- 7.2.4.2. Dynamics of average price of product's exports from Brazil by countries, 2018-2024, $ US/t
-
7.1. Exports (Direct Data)
-
8. Trade balance
-
8.1. Trade balance (Direct Data)
- 8.1.1. In kind, t
- 8.1.2. In value, K $ US
-
8.2. Trade balance (Mirror Data)
- 8.2.1. In kind, t
- 8.2.2. In value, K $ US
-
8.1. Trade balance (Direct Data)
-
9. Top buying and selling countries, 2018-2024
-
9.1. Direct Data
- 9.1.1. Import in Value by Countries-buyers
- 9.1.2. Export in Value by Countries-suppliers
-
9.2. Mirror Data
- 9.2.1. Import in Value by Countries-buyers
- 9.2.2. Export in Value by Countries-suppliers
-
9.1. Direct Data
Production flour or powder of sago, roots or tubers in MERCOSUR
In kind, 2017-2020, K t
Top producers of flour or powder of sago, roots or tubers, 2017-2020
World map of production of flour or powder of sago, roots or tubers, 2017-2020
MERCOSUR's production of flour or powder from sago, roots, or tubers rebounded after a two-year decline. In 2019, output reached its lowest point at 976 thousand tonnes, but then increased by 3.4% in 2020 to 1,009 thousand tonnes. The most significant drop occurred in 2018, with a 3.4% decrease.
Annual dynamics of production in MERCOSUR in kind, 2017-2020, K t
| Parameter | 2018 | 2019 | 2020 | CAGR | |
|---|---|---|---|---|---|
| 1 | Change from last year | (3.4%) | (1.4%) | 3.4% | (0.5%) |
In value, 2017-2020, M $ US
MERCOSUR's production value of flour or powder from sago, roots, or tubers fell for the third straight year. In 2020, it amounted to 1,071 million US dollars, down 2.5% from the previous year. From 2017 to 2020, production value declined by 16%, averaging a 5.6% annual decrease.
Annual dynamics of production in MERCOSUR in value, 2017-2020, M $ US
| Parameter | 2018 | 2019 | 2020 | CAGR | |
|---|---|---|---|---|---|
| 1 | Change from last year | (2.6%) | (11.6%) | (2.5%) | (5.6%) |
Exports flour or powder of sago, roots or tubers from MERCOSUR
Exports in kind, t
MERCOSUR's export volume of flour or powder from sago, roots, or tubers reached 16,551 tonnes in 2020, a 50.3% jump from 2019. Over the 2017-2020 period, exports grew by 106.5%, with a compound annual growth rate of 27.3%. The largest decline was in 2019, at 6.6%.
Annual dynamics of product's exports from MERCOSUR in kind, 2017-2020, t
| Parameter | 2018 | 2019 | 2020 | CAGR | |
|---|---|---|---|---|---|
| 1 | Change from last year | 47.2% | (6.6%) | 50.3% | 27.3% |
From 2017 to 2020, the United States was the leading market for MERCOSUR's exports in volume, capturing 84.8% of total flows, while other countries accounted for the remainder.
Structure of product's exports in kind by countries, 2017-2020
World map of product's exports from MERCOSUR in kind, 2017-2020
Exports in value, K $ US
In 2020, MERCOSUR's export value of flour or powder from sago, roots, or tubers stood at 17,567 thousand US dollars, up 41.8% from the prior year. Between 2017 and 2020, export value rose by 76.1%, with a compound annual growth rate of 20.8%. The largest decrease was in 2019, at 16.3%, while the biggest increase was in 2018, at 48.4%.
Annual dynamics of product's exports from MERCOSUR in value, 2017-2020, K $ US
| Parameter | 2018 | 2019 | 2020 | CAGR | |
|---|---|---|---|---|---|
| 1 | Change from last year | 48.4% | (16.3%) | 41.8% | 20.8% |
During 2017-2020, the United States remained the primary market for MERCOSUR's exports in value terms, holding an 87.1% share of total flows, with the rest distributed among various other destinations.
Structure of product's exports in value by countries, 2017-2020
World map of product's exports from MERCOSUR in value, 2017-2020
Imports flour or powder of sago, roots or tubers to MERCOSUR
Imports in kind, t
MERCOSUR's import volume of flour or powder from sago, roots, or tubers recovered after a two-year slide. In 2019, imports hit a low of 456 tonnes, but then surged by 39.7% in 2020 to 637 tonnes. Over the 2017-2020 period, imports decreased by 4.7%, with a compound annual growth rate of -1.6%. The steepest drop was in 2018, at 29.7%.
Annual dynamics of product's imports to MERCOSUR in kind, 2017-2020, t
| Parameter | 2018 | 2019 | 2020 | CAGR | |
|---|---|---|---|---|---|
| 1 | Change from last year | (29.7%) | (3.0%) | 39.7% | (1.6%) |
From 2017 to 2020, Peru, Nigeria, and China were the key sources for MERCOSUR's imports in volume, with shares of 40.6%, 9.9%, and 0.6%, respectively, totaling 51.1% of all imports.
Structure of product's imports in kind by countries, 2017-2020
World map of product's imports to MERCOSUR in kind, 2017-2020
Imports in value, K $ US
MERCOSUR's import value of flour or powder from sago, roots, or tubers rose for the third consecutive year. In 2020, it totaled 2,300 thousand US dollars, a 44.3% increase from 2019. Between 2017 and 2020, import value climbed by 73.9%, averaging a 20.3% annual growth rate.
Annual dynamics of product's imports to MERCOSUR in value, 2017-2020, K $ US
| Parameter | 2018 | 2019 | 2020 | CAGR | |
|---|---|---|---|---|---|
| 1 | Change from last year | 7.2% | 12.4% | 44.3% | 20.3% |
Over 2017-2020, Peru was the dominant supplier of flour or powder from sago, roots, or tubers to MERCOSUR in value terms, accounting for 71.7% of total imports, while other countries made up the balance.
Structure of product's imports in value by countries, 2017-2020
World map of product's imports to MERCOSUR in value, 2017-2020
Related Reports


Cereal germ market in MERCOSUR
2026-03-28

2026-03-28

Why Choose Us?
Only Verified Data
No Hidden Costs or Separate Fees
Smarter Subscription Pricing
Contact Our Team
Submit your inquiry using the form below — our team will get back to you within 24 hours.