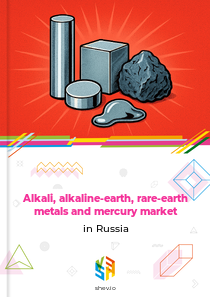







Earlier Report Observations
From 2018 to 2020, production of alkali, alkaline-earth, and rare-earth metals in Russia gradually increased, supported by the development of mining and expansion of production capacities. State-owned companies, such as Rosatom, played a key role in securing the raw material base. Growing interest from high-tech industries, like electronics, and the introduction of new technologies for cheaper extraction stimulated output. In 2020, the COVID-19 pandemic caused supply chain disruptions, which further motivated the development of domestic production and strengthened state support for the industry.
In 2021, the launch of new enrichment plants and increased activity by major companies contributed to further production growth, pushing market volume higher. However, in 2022, the inclusion of rare-earth metals in the list of strategic mineral resources of the Russian Federation and pressure from global factors, such as Chinese dumping, led to a contraction in both production and total market size. Government initiatives for mining and processing development continued during this period. By 2023, while production saw a temporary decline, the commissioning of large deposits to their design capacity and enhanced regulatory focus laid the groundwork for a market recovery.
By 2024, production rebounded due to the development and implementation of new low-cost extraction technologies, which reduced operating expenses, alongside the continued expansion of production facilities. Active involvement by state-owned companies and major industrial players supported this upward trend. In 2025, the sector gained prominence on the national economic agenda, with plans by Rusal to scale up scandium oxide production and ongoing state programs aimed at establishing full-cycle production, signaling Russia's intent to strengthen its position in the global market.
Table of content
- 1. Disclaimer
- 2. Terms of use of the report
- 3. Product codes in the statistical classifications used in the report
-
4. Key Market Indicators and Trends
-
4.1. Key Market Indicators
-
4.1.1. In kind
- 4.1.1.1. Delta residuals, 2018-2025
- 4.1.1.2. Production, 2018-2025
- 4.1.1.3. Imports, 2018-2024
- 4.1.1.4. Exports, 2018-2024
- 4.1.1.5. Market size, 2018-2024
-
4.1.1. In kind
- 4.2. Market Trends and Factors
-
4.1. Key Market Indicators
-
5. Production
-
5.1. Production in Russia, 2018–2026 (2026 — for 1 months)
- 5.1.1. Annual dynamics of production Russia in kind, 2018–2026 (2026 — for 1 months), t
- 5.1.2. Production by federal districts of Russia, 2018–2026 (2026 — for 1 months), t
- 5.1.3. Structure of production by federal districts, 2018–2026 (2026 — for 1 months)
- 5.1.4. Dynamics of production structure by federal districts, 2018–2026 (2026 — for 1 months)
- 5.1.5. Monthly dynamics of production, 2017-2024, t
-
5.2. Shipments, 2018–2026 (2026 — for 1 months)
- 5.2.1. Annual dynamics of shipments in Russia, 2018–2026 (2026 — for 1 months), t
- 5.2.2. Shipments by federal districts of Russia, 2018–2026 (2026 — for 1 months), t
- 5.2.3. Structure of shipments by federal districts, 2018–2026 (2026 — for 1 months)
- 5.2.4. Dynamics of shipments structure by federal districts, 2018–2026 (2026 — for 1 months)
-
5.3. Warehouse Residuals, 2018–2026 (2026 — for 1 months)
- 5.3.1. Monthly dynamics of warehouse residuals, 2018–2026 (2026 — for 1 months), t
-
5.4. Average producer prices, 2018-2026
- 5.4.1. 20.13.23 - Alkali and alkali-earth metals; rare earth metals, including scandium and yttrium; mercury, $ US/kg
-
5.1. Production in Russia, 2018–2026 (2026 — for 1 months)
-
6. Imports
-
6.1. Imports (Direct Data*)
- 6.1.1. Imports - Total information
-
6.1.2. Imports in kind, t
- 6.1.2.1. Annual dynamics of product's imports to Russia in kind, 2018-2024, t
- 6.1.2.2. Dynamics of product's imports in kind to Russia by countries, 2018-2024, t
- 6.1.2.3. Structure of product's imports in kind by countries, 2018-2024
-
6.1.3. Imports in value, K $ US
- 6.1.3.1. Annual dynamics of product's imports to Russia in value, 2018-2024, K $ US
- 6.1.3.2. Dynamics of product's imports in value to Russia by countries, 2018-2024, K $ US
- 6.1.3.3. Structure of product's imports in value by countries, 2018-2024
-
6.1.4. Average price of product's imports, $ US/kg
- 6.1.4.1. Annual dynamics of average price of product's imports to Russia, 2018-2024, $ US/kg
- 6.1.4.2. Dynamics of average price of product's imports to Russia by countries, 2018-2024, $ US/kg
-
6.2. Imports (Mirror Data)
- 6.2.1. Imports - Total information
-
6.2.2. Imports in kind, t
- 6.2.2.1. Annual dynamics of product's imports to Russia in kind, 2018-2024, t
- 6.2.2.2. Dynamics of product's imports in kind to Russia by countries, 2018-2024, t
- 6.2.2.3. Structure of product's imports in kind by countries, 2018-2024
-
6.2.3. Imports in value, K $ US
- 6.2.3.1. Annual dynamics of product's imports to Russia in value, 2018-2024, K $ US
- 6.2.3.2. Dynamics of product's imports in value to Russia by countries, 2018-2024, K $ US
- 6.2.3.3. Structure of product's imports in value by countries, 2018-2024
-
6.2.4. Average price of product's imports, $ US/kg
- 6.2.4.1. Annual dynamics of average price of product's imports to Russia, 2018-2024, $ US/kg
- 6.2.4.2. Dynamics of average price of product's imports to Russia by countries, 2018-2024, $ US/kg
-
6.1. Imports (Direct Data*)
-
7. Exports
-
7.1. Exports (Direct Data*)
- 7.1.1. Exports - Total information
-
7.1.2. Exports in kind, t
- 7.1.2.1. Annual dynamics of product's exports from Russia in kind, 2018-2024, t
- 7.1.2.2. Dynamics of product's exports in kind from Russia by countries, 2018-2024, t
- 7.1.2.3. Structure of product's exports in kind by countries, 2018-2024
-
7.1.3. Exports in value, K $ US
- 7.1.3.1. Annual dynamics of product's exports from Russia in value, 2018-2024, K $ US
- 7.1.3.2. Dynamics of product's exports in value from Russia by countries, 2018-2024, K $ US
- 7.1.3.3. Structure of product's exports in value by countries, 2018-2024
-
7.1.4. Average price of product's exports, $ US/kg
- 7.1.4.1. Annual dynamics of average price of product's exports from Russia, 2018-2024, $ US/kg
- 7.1.4.2. Dynamics of average price of product's exports from Russia by countries, 2018-2024, $ US/kg
-
7.2. Exports (Mirror Data)
- 7.2.1. Exports - Total information
-
7.2.2. Exports in kind, t
- 7.2.2.1. Annual dynamics of product's exports from Russia in kind, 2018-2024, t
- 7.2.2.2. Dynamics of product's exports in kind from Russia by countries, 2018-2024, t
- 7.2.2.3. Structure of product's exports in kind by countries, 2018-2024
-
7.2.3. Exports in value, K $ US
- 7.2.3.1. Annual dynamics of product's exports from Russia in value, 2018-2024, K $ US
- 7.2.3.2. Dynamics of product's exports in value from Russia by countries, 2018-2024, K $ US
- 7.2.3.3. Structure of product's exports in value by countries, 2018-2024
-
7.2.4. Average price of product's exports, $ US/kg
- 7.2.4.1. Annual dynamics of average price of product's exports from Russia, 2018-2024, $ US/kg
- 7.2.4.2. Dynamics of average price of product's exports from Russia by countries, 2018-2024, $ US/kg
-
7.1. Exports (Direct Data*)
-
8. Trade balance
-
8.1. Trade balance (Direct Data)
- 8.1.1. In kind, t
- 8.1.2. In value, K $ US
-
8.2. Trade balance (Mirror Data)
- 8.2.1. In kind, t
- 8.2.2. In value, K $ US
-
8.1. Trade balance (Direct Data)
-
9. Top buying and selling countries, 2018-2024
-
9.1. Direct Data
- 9.1.1. Import in Value by Countries-buyers
- 9.1.2. Export in Value by Countries-suppliers
-
9.2. Mirror Data
- 9.2.1. Import in Value by Countries-buyers
- 9.2.2. Export in Value by Countries-suppliers
-
9.1. Direct Data
Production alkali, alkaline-earth, rare-earth metals and mercury in Russia
In kind, 2018-2021, t
Russia's production of alkali, alkaline-earth, rare-earth metals, and mercury has grown for the third year in a row. In 2021, the country produced 7 683 tonnes of these materials, representing a 2.0% increase from the previous year. Looking at the period from 2018 to 2021, production rose by 19.9%, which translates to an average annual growth rate of 6.2%.
Annual dynamics of production in Russia in kind, 2018-2021, t
| Parameter | 2019 | 2020 | 2021 | CAGR | |
|---|---|---|---|---|---|
| 1 | Change from last year | 10.4% | 6.4% | 2.0% | 6.2% |
Exports alkali, alkaline-earth, rare-earth metals and mercury from Russia
Exports in kind, t
In 2021, Russia exported 2 547 tonnes of alkali, alkaline-earth, rare-earth metals, and mercury, showing little change from 2020. Over the four-year span from 2018 to 2021, exports grew by 10.7%, averaging a 3.5% annual increase. The most significant drop occurred in 2020, at 0.2%, while the largest gain was in 2019, with a 10.7% rise.
Annual dynamics of product's exports from Russia in kind, 2018-2021, t
| Parameter | 2019 | 2020 | 2021 | CAGR | |
|---|---|---|---|---|---|
| 1 | Change from last year | 10.7% | (0.2%) | 0.2% | 3.5% |
From 2018 to 2021, the Netherlands, Germany, and Kazakhstan were the top destinations for Russia's exports of these metals in volume terms. The Netherlands accounted for 57.9% of exports, Germany for 9.9%, and Kazakhstan for 7.4%, together making up 75.2% of the total export flows.
Structure of product's exports in kind by countries, 2018-2021
World map of product's exports from Russia in kind, 2018-2021
Exports in value, K $ US
In 2021, Russia's exports of alkali, alkaline-earth, rare-earth metals, and mercury in value terms reached 34 253 thousand US dollars, up 3.9% from the previous year. However, over the 2018-2021 period, export value fell by 6.2%, averaging a 2.1% annual decline. The lowest value was recorded in 2020 at 32 964 thousand US dollars, and the highest in 2019 at 40 450 thousand US dollars. The sharpest decrease was in 2020, down 18.5%, while the biggest increase was in 2019, up 10.8%.
Annual dynamics of product's exports from Russia in value, 2018-2021, K $ US
| Parameter | 2019 | 2020 | 2021 | CAGR | |
|---|---|---|---|---|---|
| 1 | Change from last year | 10.8% | (18.5%) | 3.9% | (2.1%) |
Between 2018 and 2021, Germany, the Netherlands, and the United States were the leading markets for Russia's exports of these metals in value terms. Germany took 45.3% of exports, the Netherlands 16.4%, and the United States 10.2%, collectively absorbing 71.9% of the total export value.
Structure of product's exports in value by countries, 2018-2021
World map of product's exports from Russia in value, 2018-2021
Imports alkali, alkaline-earth, rare-earth metals and mercury to Russia
Imports in kind, t
After two years of decline, Russia's imports of alkali, alkaline-earth, rare-earth metals, and mercury rebounded in 2021. Imports reached 3 424 tonnes, surging 33.5% compared to 2020. Despite this, over the 2018-2021 timeframe, imports decreased by 3.1%, averaging a 1.0% annual drop. The lowest volume was in 2020 at 2 565 tonnes, with the most notable decline that year at 14.9%.
Annual dynamics of product's imports to Russia in kind, 2018-2021, t
| Parameter | 2019 | 2020 | 2021 | CAGR | |
|---|---|---|---|---|---|
| 1 | Change from last year | (14.7%) | (14.9%) | 33.5% | (1.0%) |
From 2018 to 2021, China was by far the dominant supplier of these metals to Russia in volume terms, representing 91.9% of total imports.
Structure of product's imports in kind by countries, 2018-2021
World map of product's imports to Russia in kind, 2018-2021
Imports in value, K $ US
The import market for these metals in Russia exhibited volatility during the observed period. In 2021, imports in value terms hit 22 831 thousand US dollars, a dramatic 105.9% increase from the previous year. The lowest value was in 2020 at 11 088 thousand US dollars, and the largest decline occurred in 2019, down 13.8%. Overall, imports peaked in 2021 and bottomed out in 2020, with a 2.1-fold difference between these years.
Annual dynamics of product's imports to Russia in value, 2018-2021, K $ US
| Parameter | 2019 | 2020 | 2021 | CAGR | |
|---|---|---|---|---|---|
| 1 | Change from last year | (13.8%) | (8.8%) | 105.9% | 17.4% |
Between 2018 and 2021, China remained the overwhelmingly dominant supplier of these metals to Russia in value terms, accounting for 91.4% of total imports.
Structure of product's imports in value by countries, 2018-2021
World map of product's imports to Russia in value, 2018-2021
Related Reports


Why Choose Us?
Only Verified Data
No Hidden Costs or Separate Fees
Smarter Subscription Pricing
Contact Our Team
Submit your inquiry using the form below — our team will get back to you within 24 hours.