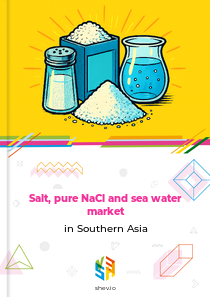







"Southern Asia" region includes following countries:
 Afghanistan
 Bangladesh
 Bhutan
 Sri Lanka
 India
India Iran
Iran Maldives
 Nepal
Nepal Pakistan
Earlier Report Observations
From 2018 to 2022, the salt market volume in Southern Asia declined from 37 891 thousand tons to 34 154 thousand tons. This reduction was partly driven by climate change challenges affecting solar salt production, which relies on predictable weather patterns. Concurrently, government-led modernization and mechanization initiatives helped maintain production efficiency.
In value terms, the market peaked at 5 251 million USD in 2021, fueled by growing demand for double-fortified salts to address public health needs and the emergence of new product segments like flavored salts. Major players such as Tata Chemicals played a key role in driving innovation and expanding production capacity.
In 2023-2024, the market saw significant developments, including Tata Chemicals' commissioning of a large-scale solar salt facility in Gujarat and rising export volumes. Consumer preferences shifted towards health-enhanced salts, prompting product innovation and sustainable packaging changes.
Table of content
- 1. Disclaimer
- 2. Terms of use of the report
- 3. Product codes in the statistical classifications used in the report
-
4. Key Market Indicators and Trends
-
4.1. Key Market Indicators
-
4.1.1. In kind
- 4.1.1.1. Production, 2018-2022
- 4.1.1.2. Imports, 2018-2024
- 4.1.1.3. Exports, 2018-2024
- 4.1.1.4. Market size, 2018-2022
-
4.1.2. In value
- 4.1.2.1. Production, 2018-2022
- 4.1.2.2. Imports, 2018-2024
- 4.1.2.3. Exports, 2018-2024
- 4.1.2.4. Market size, 2018-2022
-
4.1.1. In kind
- 4.2. Market Trends and Factors
-
4.1. Key Market Indicators
-
5. Production
-
5.1. Production in Southern Asia
- 5.1.1. Annual dynamics of production in Southern Asia in kind, 2018-2022, K t
-
5.2. Global production by Country, 2018-2022
- 5.2.1. Annual dynamics of production by country in kind, 2018-2022, K t
- 5.2.2. Structure of production by countries in kind, 2018-2022
- 5.2.3. Dynamics of peoduction structure by countries in kind, 2018-2022
-
5.1. Production in Southern Asia
-
6. Imports
-
6.1. Imports (Direct Data*)
- 6.1.1. Imports - Total information
-
6.1.2. Imports in kind, K t
- 6.1.2.1. Annual dynamics of product's imports to Afghanistan in kind, 2018-2024, K t
- 6.1.2.2. Dynamics of product's imports in kind to Afghanistan by countries, 2018-2024, K t
- 6.1.2.3. Structure of product's imports in kind by countries, 2018-2024
-
6.1.3. Imports in value, M $ US
- 6.1.3.1. Annual dynamics of product's imports to Afghanistan in value, 2018-2024, M $ US
- 6.1.3.2. Dynamics of product's imports in value to Afghanistan by countries, 2018-2024, M $ US
- 6.1.3.3. Structure of product's imports in value by countries, 2018-2024
-
6.1.4. Average price of product's imports, $ US/t
- 6.1.4.1. Annual dynamics of average price of product's imports to Afghanistan, 2018-2024, $ US/t
- 6.1.4.2. Dynamics of average price of product's imports to Afghanistan by countries, 2018-2024, $ US/t
-
6.2. Imports (Mirror Data)
- 6.2.1. Imports - Total information
-
6.2.2. Imports in kind, K t
- 6.2.2.1. Annual dynamics of product's imports to Afghanistan in kind, 2018-2024, K t
- 6.2.2.2. Dynamics of product's imports in kind to Afghanistan by countries, 2018-2024, K t
- 6.2.2.3. Structure of product's imports in kind by countries, 2018-2024
-
6.2.3. Imports in value, M $ US
- 6.2.3.1. Annual dynamics of product's imports to Afghanistan in value, 2018-2024, M $ US
- 6.2.3.2. Dynamics of product's imports in value to Afghanistan by countries, 2018-2024, M $ US
- 6.2.3.3. Structure of product's imports in value by countries, 2018-2024
-
6.2.4. Average price of product's imports, $ US/t
- 6.2.4.1. Annual dynamics of average price of product's imports to Afghanistan, 2018-2024, $ US/t
- 6.2.4.2. Dynamics of average price of product's imports to Afghanistan by countries, 2018-2024, $ US/t
-
6.1. Imports (Direct Data*)
-
7. Exports
-
7.1. Exports (Direct Data*)
- 7.1.1. Exports - Total information
-
7.1.2. Exports in kind, K t
- 7.1.2.1. Annual dynamics of product's exports from Afghanistan in kind, 2018-2024, K t
- 7.1.2.2. Dynamics of product's exports in kind from Afghanistan by countries, 2018-2024, K t
- 7.1.2.3. Structure of product's exports in kind by countries, 2018-2024
-
7.1.3. Exports in value, M $ US
- 7.1.3.1. Annual dynamics of product's exports from Afghanistan in value, 2018-2024, M $ US
- 7.1.3.2. Dynamics of product's exports in value from Afghanistan by countries, 2018-2024, M $ US
- 7.1.3.3. Structure of product's exports in value by countries, 2018-2024
-
7.1.4. Average price of product's exports, $ US/t
- 7.1.4.1. Annual dynamics of average price of product's exports from Afghanistan, 2018-2024, $ US/t
- 7.1.4.2. Dynamics of average price of product's exports from Afghanistan by countries, 2018-2024, $ US/t
-
7.2. Exports (Mirror Data)
- 7.2.1. Exports - Total information
-
7.2.2. Exports in kind, K t
- 7.2.2.1. Annual dynamics of product's exports from Afghanistan in kind, 2018-2024, K t
- 7.2.2.2. Dynamics of product's exports in kind from Afghanistan by countries, 2018-2024, K t
- 7.2.2.3. Structure of product's exports in kind by countries, 2018-2024
-
7.2.3. Exports in value, M $ US
- 7.2.3.1. Annual dynamics of product's exports from Afghanistan in value, 2018-2024, M $ US
- 7.2.3.2. Dynamics of product's exports in value from Afghanistan by countries, 2018-2024, M $ US
- 7.2.3.3. Structure of product's exports in value by countries, 2018-2024
-
7.2.4. Average price of product's exports, $ US/t
- 7.2.4.1. Annual dynamics of average price of product's exports from Afghanistan, 2018-2024, $ US/t
- 7.2.4.2. Dynamics of average price of product's exports from Afghanistan by countries, 2018-2024, $ US/t
-
7.1. Exports (Direct Data*)
-
8. Trade balance
-
8.1. Trade balance (Direct Data)
- 8.1.1. In kind, K t
- 8.1.2. In value, M $ US
-
8.2. Trade balance (Mirror Data)
- 8.2.1. In kind, K t
- 8.2.2. In value, M $ US
-
8.1. Trade balance (Direct Data)
-
9. Top buying and selling countries, 2018-2024
-
9.1. Direct Data
- 9.1.1. Import in Value by Countries-buyers
- 9.1.2. Export in Value by Countries-suppliers
-
9.2. Mirror Data
- 9.2.1. Import in Value by Countries-buyers
- 9.2.2. Export in Value by Countries-suppliers
-
9.1. Direct Data
Production salt, pure NaCl and sea water in Southern Asia
In kind, 2017-2020, K t
Top producers of salt, pure NaCl and sea water, 2017-2020
World map of production of salt, pure NaCl and sea water, 2017-2020
Southern Asia's production of salt, pure NaCl, and seawater declined for the second year in a row. In 2020, the region produced 35 379 K t, representing a modest 3.0% decrease from the previous year. Looking at the period from 2017 to 2020, production fell by 5.4%, which translates to an average annual decline of 1.8%. The highest production volume was recorded in 2018 at 38 320 K t, with a 2.4% increase that year. The most significant drop occurred in 2019, when production fell by 4.8%.
Annual dynamics of production in Southern Asia in kind, 2017-2020, K t
| Parameter | 2018 | 2019 | 2020 | CAGR | |
|---|---|---|---|---|---|
| 1 | Change from last year | 2.4% | (4.8%) | (3.0%) | (1.8%) |
In value, 2017-2020, M $ US
Southern Asia's production of salt, pure NaCl, and seawater in monetary terms also declined for the second consecutive year. In 2020, the output was valued at 4 160 M $ US, marking a slight 0.7% decrease compared to 2019. The peak value was reached in 2018 at 4 366 M $ US, which saw a 6.0% increase. The largest decline was in 2019, with a 4.0% drop.
Annual dynamics of production in Southern Asia in value, 2017-2020, M $ US
| Parameter | 2018 | 2019 | 2020 | CAGR | |
|---|---|---|---|---|---|
| 1 | Change from last year | 6.0% | (4.0%) | (0.7%) | 0.3% |
Exports salt, pure NaCl and sea water from Southern Asia
Exports in kind, K t
After two years of decline, Southern Asia's exports of salt, pure NaCl, and seawater in volume terms rebounded in 2020. Exports amounted to 594 K t, representing a 12.1% increase from the previous year. Over the period from 2017 to 2020, exports decreased by 3.6%, averaging an annual decline of 1.2%. The lowest export volume was recorded in 2019 at 530 K t, which saw a 9.5% drop that year.
Annual dynamics of product's exports from Southern Asia in kind, 2017-2020, K t
| Parameter | 2018 | 2019 | 2020 | CAGR | |
|---|---|---|---|---|---|
| 1 | Change from last year | (5.1%) | (9.5%) | 12.1% | (1.2%) |
From 2017 to 2020, key buyers of salt, pure NaCl, and seawater from Southern Asia included Iraq, accounting for 16.4% of exports in kind, the United States at 11.1%, and the United Arab Emirates at 9.5%. However, these three markets combined represented only 37.0% of total exports in kind, with the remaining 63.0% distributed among numerous other trading partners.
Structure of product's exports in kind by countries, 2017-2020
World map of product's exports from Southern Asia in kind, 2017-2020
Exports in value, K $ US
Following a two-year decline, Southern Asia's exports of salt, pure NaCl, and seawater in value terms increased in 2020. Exports reached 69 885 K $ US, a 14.7% rise from 2019. Over the 2017-2020 period, exports grew by 2.9%, with a compound annual growth rate of 1.0%. The lowest value was recorded in 2019 at 60 903 K $ US, which experienced an 8.7% decline that year.
Annual dynamics of product's exports from Southern Asia in value, 2017-2020, K $ US
| Parameter | 2018 | 2019 | 2020 | CAGR | |
|---|---|---|---|---|---|
| 1 | Change from last year | (1.7%) | (8.7%) | 14.7% | 1.0% |
Between 2017 and 2020, exports of salt, pure NaCl, and seawater from Southern Asia in value terms were widely distributed across markets. The United States accounted for 20.6% of exports in value terms, Iraq for 8.4%, and the United Kingdom for 5.6%. Together, these three countries represented only 34.6% of total export flows.
Structure of product's exports in value by countries, 2017-2020
World map of product's exports from Southern Asia in value, 2017-2020
Imports salt, pure NaCl and sea water to Southern Asia
Imports in kind, K t
Southern Asia's imports of salt, pure NaCl, and seawater in volume terms increased for the third consecutive year in 2020. The region imported 234 K t, marking a 14.5% year-over-year uptick. From 2017 to 2020, imports surged by 353.6%, averaging an annual growth rate of 65.5%.
Annual dynamics of product's imports to Southern Asia in kind, 2017-2020, K t
| Parameter | 2018 | 2019 | 2020 | CAGR | |
|---|---|---|---|---|---|
| 1 | Change from last year | 203.5% | 30.6% | 14.5% | 65.5% |
Throughout 2017 to 2020, China and Asia, not elsewhere specified, were the leading sources for Southern Asia's imports in kind, jointly accounting for 3.9% of total import flows.
Structure of product's imports in kind by countries, 2017-2020
World map of product's imports to Southern Asia in kind, 2017-2020
Imports in value, K $ US
After two years of decline, Southern Asia's imports of salt, pure NaCl, and seawater in value terms increased in 2020. Imports reached 32 847 K $ US, a 5.9% improvement from 2019. Over the period from 2017 to 2020, imports decreased by 20.5%, averaging an annual decline of 7.3%. The lowest value was recorded in 2019 at 31 015 K $ US, which saw a 14.8% drop that year.
Annual dynamics of product's imports to Southern Asia in value, 2017-2020, K $ US
| Parameter | 2018 | 2019 | 2020 | CAGR | |
|---|---|---|---|---|---|
| 1 | Change from last year | (11.9%) | (14.8%) | 5.9% | (7.3%) |
From 2017 to 2020, imports of salt, pure NaCl, and seawater to Southern Asia in value terms were spread across a large number of markets. China accounted for 10.3% of imports in value terms, Thailand for 3.3%, and Asia, not elsewhere specified for 2.6%. Together, these three sources represented only 16.2% of total import flows.
Structure of product's imports in value by countries, 2017-2020
World map of product's imports to Southern Asia in value, 2017-2020
Related Reports

Barytes market in Southern Asia
2026-03-29
Feldspar market in Southern Asia
2026-03-29

Magnesite market in Southern Asia
2026-03-29

In-depth market research on this product
Global Sea Salt Market 2021–2031: Size, Share, Trends and Forecast
Global market report: size, trends and forecast to 2031 · 184 pages
Why Choose Us?
Only Verified Data
No Hidden Costs or Separate Fees
Smarter Subscription Pricing
Contact Our Team
Submit your inquiry using the form below — our team will get back to you within 24 hours.