






"Melanesia" region includes following countries:
 Solomon Islands
 Fiji
Fiji New Caledonia
 Vanuatu
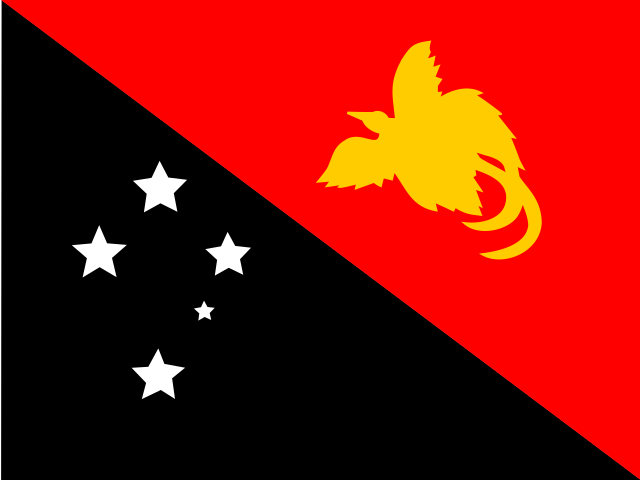 Papua New Guinea
Earlier Report Observations
From 2018 to 2020, the market volume for nutmeg, mace and cardamoms in Melanesia expanded from 158.2 tons to 196.8 tons. This growth was primarily supported by a sharp rise in imports, which increased from 58.6 tons to 84.0 tons over the same period, while domestic production remained stable at around 112 to 113 tons.
The market contracted significantly to 151.5 tons in 2021, coinciding with a halving of import volumes to 40.4 tons. A partial recovery followed in 2022, with the market reaching 180.7 tons as imports rebounded to 68.5 tons, before declining again to 158.0 tons in 2023 amidst lower import levels. Throughout the period, domestic production showed only minor fluctuations, and exports played a negligible role in overall market size after 2018.
Table of content
- 1. Disclaimer
- 2. Terms of use of the report
- 3. Product codes in the statistical classifications used in the report
-
4. Key Market Indicators and Trends
-
4.1. Key Market Indicators
-
4.1.1. In kind
- 4.1.1.1. Production, 2018-2023
- 4.1.1.2. Imports, 2018-2024
- 4.1.1.3. Exports, 2018-2024
- 4.1.1.4. Market size, 2018-2023
-
4.1.1. In kind
- 4.2. Market Trends and Factors
-
4.1. Key Market Indicators
-
5. Production
-
5.1. Production in Melanesia
- 5.1.1. Annual dynamics of production in Melanesia in kind, 2018-2023, t
-
5.2. Global production by Country, 2018-2023
- 5.2.1. Annual dynamics of production by macroregions in kind, 2018-2023, t
- 5.2.2. Dynamics of production structure by macroregions in kind, 2018-2023
- 5.2.3. Annual dynamics of production by country in kind, 2018-2023, t
- 5.2.4. Structure of production by countries in kind, 2018-2023
- 5.2.5. Dynamics of peoduction structure by countries in kind, 2018-2023
-
5.1. Production in Melanesia
-
6. Imports
-
6.1. Imports (Direct Data*)
- 6.1.1. Imports - Total information
-
6.1.2. Imports in kind, kg
- 6.1.2.1. Annual dynamics of product's imports to Solomon Islands in kind, 2018-2024, kg
- 6.1.2.2. Dynamics of product's imports in kind to Solomon Islands by countries, 2018-2024, kg
- 6.1.2.3. Structure of product's imports in kind by countries, 2018-2024
-
6.1.3. Imports in value, K $ US
- 6.1.3.1. Annual dynamics of product's imports to Solomon Islands in value, 2018-2024, K $ US
- 6.1.3.2. Dynamics of product's imports in value to Solomon Islands by countries, 2018-2024, K $ US
- 6.1.3.3. Structure of product's imports in value by countries, 2018-2024
-
6.1.4. Average price of product's imports, $ US/kg
- 6.1.4.1. Annual dynamics of average price of product's imports to Solomon Islands, 2018-2024, $ US/kg
- 6.1.4.2. Dynamics of average price of product's imports to Solomon Islands by countries, 2018-2024, $ US/kg
-
6.2. Imports (Mirror Data)
- 6.2.1. Imports - Total information
-
6.2.2. Imports in kind, kg
- 6.2.2.1. Annual dynamics of product's imports to Solomon Islands in kind, 2018-2024, kg
- 6.2.2.2. Dynamics of product's imports in kind to Solomon Islands by countries, 2018-2024, kg
- 6.2.2.3. Structure of product's imports in kind by countries, 2018-2024
-
6.2.3. Imports in value, K $ US
- 6.2.3.1. Annual dynamics of product's imports to Solomon Islands in value, 2018-2024, K $ US
- 6.2.3.2. Dynamics of product's imports in value to Solomon Islands by countries, 2018-2024, K $ US
- 6.2.3.3. Structure of product's imports in value by countries, 2018-2024
-
6.2.4. Average price of product's imports, $ US/kg
- 6.2.4.1. Annual dynamics of average price of product's imports to Solomon Islands, 2018-2024, $ US/kg
- 6.2.4.2. Dynamics of average price of product's imports to Solomon Islands by countries, 2018-2024, $ US/kg
-
6.1. Imports (Direct Data*)
-
7. Exports
-
7.1. Exports (Direct Data*)
- 7.1.1. Exports - Total information
-
7.1.2. Exports in kind, kg
- 7.1.2.1. Annual dynamics of product's exports from Solomon Islands in kind, 2018-2024, kg
- 7.1.2.2. Dynamics of product's exports in kind from Solomon Islands by countries, 2018-2024, kg
- 7.1.2.3. Structure of product's exports in kind by countries, 2018-2024
-
7.1.3. Exports in value, K $ US
- 7.1.3.1. Annual dynamics of product's exports from Solomon Islands in value, 2018-2024, K $ US
- 7.1.3.2. Dynamics of product's exports in value from Solomon Islands by countries, 2018-2024, K $ US
- 7.1.3.3. Structure of product's exports in value by countries, 2018-2024
-
7.1.4. Average price of product's exports, $ US/kg
- 7.1.4.1. Annual dynamics of average price of product's exports from Solomon Islands, 2018-2024, $ US/kg
- 7.1.4.2. Dynamics of average price of product's exports from Solomon Islands by countries, 2018-2024, $ US/kg
-
7.2. Exports (Mirror Data)
- 7.2.1. Exports - Total information
-
7.2.2. Exports in kind, kg
- 7.2.2.1. Annual dynamics of product's exports from Solomon Islands in kind, 2018-2024, kg
- 7.2.2.2. Dynamics of product's exports in kind from Solomon Islands by countries, 2018-2024, kg
- 7.2.2.3. Structure of product's exports in kind by countries, 2018-2024
-
7.2.3. Exports in value, K $ US
- 7.2.3.1. Annual dynamics of product's exports from Solomon Islands in value, 2018-2024, K $ US
- 7.2.3.2. Dynamics of product's exports in value from Solomon Islands by countries, 2018-2024, K $ US
- 7.2.3.3. Structure of product's exports in value by countries, 2018-2024
-
7.2.4. Average price of product's exports, $ US/kg
- 7.2.4.1. Annual dynamics of average price of product's exports from Solomon Islands, 2018-2024, $ US/kg
- 7.2.4.2. Dynamics of average price of product's exports from Solomon Islands by countries, 2018-2024, $ US/kg
-
7.1. Exports (Direct Data*)
-
8. Trade balance
-
8.1. Trade balance (Direct Data)
- 8.1.1. In kind, kg
- 8.1.2. In value, K $ US
-
8.2. Trade balance (Mirror Data)
- 8.2.1. In kind, kg
- 8.2.2. In value, K $ US
-
8.1. Trade balance (Direct Data)
-
9. Top buying and selling countries, 2018-2024
-
9.1. Direct Data
- 9.1.1. Import in Value by Countries-buyers
- 9.1.2. Export in Value by Countries-suppliers
-
9.2. Mirror Data
- 9.2.1. Import in Value by Countries-buyers
- 9.2.2. Export in Value by Countries-suppliers
-
9.1. Direct Data
Production nutmeg, mace and cardamoms in Melanesia
In kind, 2017-2020, t
Top producers of nutmeg, mace and cardamoms, 2017-2020
World map of production of nutmeg, mace and cardamoms, 2017-2020
Melanesia's production of nutmeg, mace, and cardamoms has increased for the second consecutive year. In 2020, the region produced 113.3 t of these spices, showing minimal change from the 2019 level. Looking at the broader period from 2017 to 2020, production grew by 2.2%, which translates to an average annual increase of 0.7%. The lowest production volume was recorded in 2018 at 108.5 t, which also saw the largest decline of 2.1%. In contrast, 2019 experienced the most significant growth, with a 4.0% increase.
Annual dynamics of production in Melanesia in kind, 2017-2020, t
| Parameter | 2018 | 2019 | 2020 | CAGR | |
|---|---|---|---|---|---|
| 1 | Change from last year | (2.1%) | 4.0% | 0.4% | 0.7% |
Exports nutmeg, mace and cardamoms from Melanesia
Exports in kind, kg
The market displayed considerable volatility during these years. Export volumes fluctuated dramatically, with a 16-fold difference between the peak in 2018 and the low in 2020. In 2020, Melanesia's cross-border shipments of nutmeg, mace, and cardamoms totaled 547 kg, representing a 33.1% decrease compared to the previous year. The highest export volume was recorded in 2018 at 8 909 kg, which also saw the largest increase of 22.6%. The most substantial decline occurred in 2019, with a drop of 90.8%.
Annual dynamics of product's exports from Melanesia in kind, 2017-2020, kg
| Parameter | 2018 | 2019 | 2020 | CAGR | |
|---|---|---|---|---|---|
| 1 | Change from last year | 22.6% | (90.8%) | (33.1%) | (57.8%) |
From 2017 to 2020, the Netherlands, New Zealand, and Poland were the leading destinations for Melanesia's exports of nutmeg, mace, and cardamoms in kind. The Netherlands accounted for 57.6% of exports, followed by New Zealand at 7.8% and Poland at 4.9%. Together, these three countries represented 70.3% of total export flows.
Structure of product's exports in kind by countries, 2017-2020
World map of product's exports from Melanesia in kind, 2017-2020
Exports in value, K $ US
The market showed an unstable trend throughout this period. Export values varied significantly, with a 25-fold difference between the peak in 2018 and the trough in 2019. In 2020, Melanesia exported 8.5 K $ US worth of nutmeg, mace, and cardamoms, marking a dramatic 61.0% increase compared to the previous year. The lowest value was recorded in 2019 at 5.3 K $ US, which also saw the largest decline of 96.0%. The highest value occurred in 2018 at 132.4 K $ US, accompanied by the largest increase of 62.4%.
Annual dynamics of product's exports from Melanesia in value, 2017-2020, K $ US
| Parameter | 2018 | 2019 | 2020 | CAGR | |
|---|---|---|---|---|---|
| 1 | Change from last year | 62.4% | (96.0%) | 61.0% | (52.9%) |
During the 2017–2020 period, the Netherlands dominated Melanesia's exports in value terms, accounting for 76.4% of total flows. The remaining share was distributed among various smaller destinations.
Structure of product's exports in value by countries, 2017-2020
World map of product's exports from Melanesia in value, 2017-2020
Imports nutmeg, mace and cardamoms to Melanesia
Imports in kind, kg
Melanesia's imports of nutmeg, mace, and cardamoms have risen for the second year in a row. In 2020, imports totaled 84 028 kg, reflecting a 9.6% increase from 2019. Over the broader span from 2017 to 2020, imports grew by 3.6%, equivalent to an annualized rate of 1.2%. The lowest import volume was in 2018 at 58 622 kg, which also experienced the largest decline of 27.7%. The most significant increase was recorded in 2019, with a 30.8% rise.
Annual dynamics of product's imports to Melanesia in kind, 2017-2020, kg
| Parameter | 2018 | 2019 | 2020 | CAGR | |
|---|---|---|---|---|---|
| 1 | Change from last year | (27.7%) | 30.8% | 9.6% | 1.2% |
From 2017 to 2020, India, Singapore, and Guatemala were the top suppliers of nutmeg, mace, and cardamoms to Melanesia in kind. India led with 45.5% of imports, followed by Singapore at 20.1% and Guatemala at 12.2%. Collectively, these three countries accounted for 77.8% of total import volumes.
Structure of product's imports in kind by countries, 2017-2020
World map of product's imports to Melanesia in kind, 2017-2020
Imports in value, K $ US
The data indicates irregular changes, pointing to a volatile market environment. Import values showed a 2-fold difference between the peak in 2020 and the trough in 2019. In 2020, Melanesia imported 839.2 K $ US worth of nutmeg, mace, and cardamoms, representing a dramatic year-on-year advance of 104.6%. The lowest value was recorded in 2019 at 410.1 K $ US, which also saw the largest decline of 2.3%.
Annual dynamics of product's imports to Melanesia in value, 2017-2020, K $ US
| Parameter | 2018 | 2019 | 2020 | CAGR | |
|---|---|---|---|---|---|
| 1 | Change from last year | (0.2%) | (2.3%) | 104.6% | 25.9% |
Between 2017 and 2020, three key markets—India, Guatemala, and Singapore—collectively accounted for 90.1% of Melanesia's total import value for nutmeg, mace, and cardamoms.
Structure of product's imports in value by countries, 2017-2020
World map of product's imports to Melanesia in value, 2017-2020
Related Reports

Nutmeg, mace and cardamoms market in Malawi
2026-03-28

2026-03-28

2026-03-28

Tea in packings ≤3 kg market in Melanesia
2026-03-30

2026-03-27
In-depth market research on this product
Global Nutmeg Market 2021–2031: Size, Share, Trends and Forecast
Global market report: size, trends and forecast to 2031 · 184 pages
Global Cardamom Market 2021–2031: Size, Share, Trends and Forecast
Global market report: size, trends and forecast to 2031 · 184 pages
Global Mace Market 2021–2031: Size, Share, Trends and Forecast
Global market report: size, trends and forecast to 2031 · 184 pages
Why Choose Us?
Only Verified Data
No Hidden Costs or Separate Fees
Smarter Subscription Pricing
Contact Our Team
Submit your inquiry using the form below — our team will get back to you within 24 hours.