






Earlier Report Observations
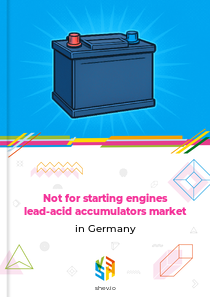
The market volume for lead-acid accumulators in Germany started at 26 263 thous. units in 2018 and grew to 27 556 thous. units in 2019, even as the onset of the COVID-19 pandemic began disrupting supply chains for renewable energy and battery storage systems, delaying solar and wind projects that use these batteries. This contributed to a subsequent dip in volume to 26 230 thous. units in 2020.
A recovery followed, with the market reaching 28 122 thous. units in 2021 and peaking at 32 710 thous. units in 2022. However, 2023 saw a sharp contraction to 21 808 thous. units, a period during which stricter EU workplace lead exposure limits were being prepared for implementation, potentially affecting production planning. In value terms, the market held steady around €1 billion, indicating a shift in product mix or pricing.
In 2024, volume rebounded to 27 067 thous. units, supported by two key developments: the EU Battery Regulation entered into force, imposing new recycled content rules and restricting lead in device batteries, while GS Yuasa launched new stationary lead-acid batteries designed for deep-cycle applications, stimulating demand in the fast-growing energy storage segment for grid stabilization.
Table of content
- 1. Disclaimer
- 2. Terms of use of the report
- 3. Product codes in the statistical classifications used in the report
-
4. Key Market Indicators and Trends
-
4.1. Key Market Indicators
-
4.1.1. In kind
- 4.1.1.1. Production, 2018-2024
- 4.1.1.2. Imports, 2018-2024
- 4.1.1.3. Exports, 2018-2024
- 4.1.1.4. Market size, 2018-2024
-
4.1.2. In value
- 4.1.2.1. Production, 2018-2024
- 4.1.2.2. Imports, 2018-2024
- 4.1.2.3. Exports, 2018-2024
- 4.1.2.4. Market size, 2018-2024
-
4.1.1. In kind
- 4.2. Market Trends and Factors
-
4.1. Key Market Indicators
-
5. Production
-
5.1. Production in Germany
- 5.1.1. In kind, 2018-2024, K unit
- 5.1.2. In value, 2018-2024, M $ US
-
5.2. Production in the EU, 2018-2024
- 5.2.1. In kind, 2018-2024, K unit
- 5.2.2. In value, 2018-2024, M $ US
-
5.1. Production in Germany
-
6. Imports
-
6.1. Imports (Direct Data)
- 6.1.1. Imports - Total information
-
6.1.2. Imports in kind, K unit
- 6.1.2.1. Annual dynamics of product's imports to Germany in kind, 2018-2024, K unit
- 6.1.2.2. Dynamics of product's imports in kind to Germany by countries, 2018-2024, K unit
- 6.1.2.3. Structure of product's imports in kind by countries, 2018-2024
-
6.1.3. Imports in value, M $ US
- 6.1.3.1. Annual dynamics of product's imports to Germany in value, 2018-2024, M $ US
- 6.1.3.2. Dynamics of product's imports in value to Germany by countries, 2018-2024, M $ US
- 6.1.3.3. Structure of product's imports in value by countries, 2018-2024
-
6.1.4. Average price of product's imports, $ US/unit
- 6.1.4.1. Annual dynamics of average price of product's imports to Germany, 2018-2024, $ US/unit
- 6.1.4.2. Dynamics of average price of product's imports to Germany by countries, 2018-2024, $ US/unit
-
6.2. Imports (Mirror Data)
- 6.2.1. Imports - Total information
-
6.2.2. Imports in kind, K unit
- 6.2.2.1. Annual dynamics of product's imports to Germany in kind, 2018-2024, K unit
- 6.2.2.2. Dynamics of product's imports in kind to Germany by countries, 2018-2024, K unit
- 6.2.2.3. Structure of product's imports in kind by countries, 2018-2024
-
6.2.3. Imports in value, M $ US
- 6.2.3.1. Annual dynamics of product's imports to Germany in value, 2018-2024, M $ US
- 6.2.3.2. Dynamics of product's imports in value to Germany by countries, 2018-2024, M $ US
- 6.2.3.3. Structure of product's imports in value by countries, 2018-2024
-
6.2.4. Average price of product's imports, $ US/unit
- 6.2.4.1. Annual dynamics of average price of product's imports to Germany, 2018-2024, $ US/unit
- 6.2.4.2. Dynamics of average price of product's imports to Germany by countries, 2018-2024, $ US/unit
-
6.1. Imports (Direct Data)
-
7. Exports
-
7.1. Exports (Direct Data)
- 7.1.1. Exports - Total information
-
7.1.2. Exports in kind, K unit
- 7.1.2.1. Annual dynamics of product's exports from Germany in kind, 2018-2024, K unit
- 7.1.2.2. Dynamics of product's exports in kind from Germany by countries, 2018-2024, K unit
- 7.1.2.3. Structure of product's exports in kind by countries, 2018-2024
-
7.1.3. Exports in value, M $ US
- 7.1.3.1. Annual dynamics of product's exports from Germany in value, 2018-2024, M $ US
- 7.1.3.2. Dynamics of product's exports in value from Germany by countries, 2018-2024, M $ US
- 7.1.3.3. Structure of product's exports in value by countries, 2018-2024
-
7.1.4. Average price of product's exports, $ US/unit
- 7.1.4.1. Annual dynamics of average price of product's exports from Germany, 2018-2024, $ US/unit
- 7.1.4.2. Dynamics of average price of product's exports from Germany by countries, 2018-2024, $ US/unit
-
7.2. Exports (Mirror Data)
- 7.2.1. Exports - Total information
-
7.2.2. Exports in kind, K unit
- 7.2.2.1. Annual dynamics of product's exports from Germany in kind, 2018-2024, K unit
- 7.2.2.2. Dynamics of product's exports in kind from Germany by countries, 2018-2024, K unit
- 7.2.2.3. Structure of product's exports in kind by countries, 2018-2024
-
7.2.3. Exports in value, M $ US
- 7.2.3.1. Annual dynamics of product's exports from Germany in value, 2018-2024, M $ US
- 7.2.3.2. Dynamics of product's exports in value from Germany by countries, 2018-2024, M $ US
- 7.2.3.3. Structure of product's exports in value by countries, 2018-2024
-
7.2.4. Average price of product's exports, $ US/unit
- 7.2.4.1. Annual dynamics of average price of product's exports from Germany, 2018-2024, $ US/unit
- 7.2.4.2. Dynamics of average price of product's exports from Germany by countries, 2018-2024, $ US/unit
-
7.1. Exports (Direct Data)
-
8. Trade balance
-
8.1. Trade balance (Direct Data)
- 8.1.1. In kind, K unit
- 8.1.2. In value, M $ US
-
8.2. Trade balance (Mirror Data)
- 8.2.1. In kind, K unit
- 8.2.2. In value, M $ US
-
8.1. Trade balance (Direct Data)
-
9. Top buying and selling countries, 2018-2024
-
9.1. Direct Data
- 9.1.1. Import in Value by Countries-buyers
- 9.1.2. Export in Value by Countries-suppliers
-
9.2. Mirror Data
- 9.2.1. Import in Value by Countries-buyers
- 9.2.2. Export in Value by Countries-suppliers
-
9.1. Direct Data
Production not for starting engines lead-acid accumulators in Germany
In value, 2017-2020, M $ US
Germany's production of lead-acid accumulators for non-starting engines declined for the third consecutive year. In 2020, output was valued at 566.8 million US dollars, marking a significant 16.5% decrease compared to 2019. From 2017 to 2020, production fell by 31.4%, which translates to an annualized decline rate of 11.8%.
Annual dynamics of production in Germany in value, 2017-2020, M $ US
| Parameter | 2018 | 2019 | 2020 | CAGR | |
|---|---|---|---|---|---|
| 1 | Change from last year | (5.9%) | (12.7%) | (16.5%) | (11.8%) |
In kind, 2017-2020, K unit
Production of lead-acid accumulators for non-starting engines in Germany declined for the third year in a row. In 2020, Germany produced 8 737 thousand units, representing a 13.3% year-over-year decrease. Between 2017 and 2020, production dropped by 19.4%, equating to an annualized rate of decline of 6.9%.
Annual dynamics of production in Germany in kind, 2017-2020, K unit
| Parameter | 2018 | 2019 | 2020 | CAGR | |
|---|---|---|---|---|---|
| 1 | Change from last year | (5.0%) | (2.2%) | (13.3%) | (6.9%) |
Exports not for starting engines lead-acid accumulators from Germany
Exports in kind, K unit
After two years of growth, Germany's exports of lead-acid accumulators for non-starting engines declined. In 2020, exports reached 21 349 thousand units, reflecting a 6.7% decrease compared to 2019. The highest export volume was recorded in 2019 at 22 871 thousand units, which also saw the largest increase of 11.2%. Overall, from 2017 to 2020, exports grew by 7.1%, with an annualized growth rate of 2.3%.
Annual dynamics of product's exports from Germany in kind, 2017-2020, K unit
| Parameter | 2018 | 2019 | 2020 | CAGR | |
|---|---|---|---|---|---|
| 1 | Change from last year | 3.2% | 11.2% | (6.7%) | 2.3% |
From 2017 to 2020, Germany's exports of lead-acid accumulators for non-starting engines were distributed across a wide range of partner countries. Poland accounted for 18.3% of exports, Switzerland for 6.4%, and the Netherlands for 6.3%, with these three countries together representing just 30.9% of total export flows.
Structure of product's exports in kind by countries, 2017-2020
World map of product's exports from Germany in kind, 2017-2020
Exports in value, M $ US
In 2020, Germany's exports of lead-acid accumulators for non-starting engines amounted to 584.0 million US dollars, showing a strong contraction of 10.4% compared to the previous year. The peak value was recorded in 2018 at 651.6 million US dollars, which also experienced the largest increase of 7.1%. Over the period from 2017 to 2020, exports decreased by 4%, with a compound annual growth rate of -1.3%.
Annual dynamics of product's exports from Germany in value, 2017-2020, M $ US
| Parameter | 2018 | 2019 | 2020 | CAGR | |
|---|---|---|---|---|---|
| 1 | Change from last year | 7.1% | (0.0%) | (10.4%) | (1.3%) |
Between 2017 and 2020, Germany's exports of lead-acid accumulators for non-starting engines in value terms were widely dispersed among partner countries. Sweden accounted for 7.3% of exports, France for 6.6%, and Poland for 5.8%, with these three countries together making up only 19.6% of total export flows.
Structure of product's exports in value by countries, 2017-2020
World map of product's exports from Germany in value, 2017-2020
Imports not for starting engines lead-acid accumulators to Germany
Imports in kind, K unit
In 2020, Germany's import volume of lead-acid accumulators for non-starting engines amounted to 38 842 thousand units, down by 3.7% from the previous year. The lowest import volume was recorded in 2018 at 36 539 thousand units, which saw the largest decline of 4.5%. In contrast, the highest volume was in 2019 at 40 350 thousand units, marking the largest increase of 10.4%.
Annual dynamics of product's imports to Germany in kind, 2017-2020, K unit
| Parameter | 2018 | 2019 | 2020 | CAGR | |
|---|---|---|---|---|---|
| 1 | Change from last year | (4.5%) | 10.4% | (3.7%) | 0.5% |
From 2017 to 2020, China was the leading supplier of lead-acid accumulators for non-starting engines to Germany, accounting for 39.5% of imports. Asia, not elsewhere specified, followed with 19.5%, and Vietnam with 15.0%. Together, these three sources represented 74.0% of total import volumes.
Structure of product's imports in kind by countries, 2017-2020
World map of product's imports to Germany in kind, 2017-2020
Imports in value, M $ US
Germany's imports of lead-acid accumulators for non-starting engines declined for the second consecutive year. In 2020, import value amounted to 500.7 million US dollars, which is 10.2% lower year-over-year. The highest import value was recorded in 2018 at 595.2 million US dollars, which also saw the largest increase of 12.8%. Between 2017 and 2020, imports decreased by 5.1%, equating to an annualized decline rate of 1.7%.
Annual dynamics of product's imports to Germany in value, 2017-2020, M $ US
| Parameter | 2018 | 2019 | 2020 | CAGR | |
|---|---|---|---|---|---|
| 1 | Change from last year | 12.8% | (6.3%) | (10.2%) | (1.7%) |
During 2017 to 2020, imports of lead-acid accumulators for non-starting engines to Germany in value terms were relatively evenly spread. China accounted for 19.3% of imports, Greece for 8.3%, and Spain for 7.9%, with these three countries jointly representing 35.5% of total import flows.
Structure of product's imports in value by countries, 2017-2020
World map of product's imports to Germany in value, 2017-2020
Related Reports

Optical fibre cables market in Germany
2026-03-30
Automatic circuit breakers market in Germany
2026-03-30

Electric heating resistors market in Germany
2026-03-30
Why Choose Us?
Only Verified Data
No Hidden Costs or Separate Fees
Smarter Subscription Pricing
Contact Our Team
Submit your inquiry using the form below — our team will get back to you within 24 hours.