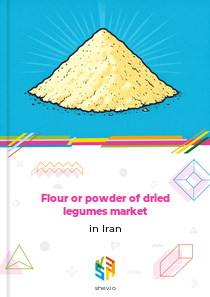







Earlier Report Observations
The market for flour and powder of dried legumes in Iran declined steadily from $15.3 million in 2018 to $6.8 million in 2021. This downturn was driven by repeated droughts and pest outbreaks in key bean-producing regions, which reduced domestic bean availability. The COVID-19 pandemic in 2020 further strained supply chains, while currency depreciation raised the cost of imported beans. In response, authorities implemented export restrictions on legumes to secure domestic supply and introduced price caps on flour and bread, though these measures had limited success in curbing price volatility.
In 2022, the market rebounded sharply, growing 58% to $10.8 million. This recovery was primarily fueled by rising consumer interest in protein-rich health drinks and shakes, which created new demand for legume flour as a protein source. Favorable global market outlooks and investments in modernized production lines also supported the expansion.
The market value fell back to $7.5 million in 2023, a 30% decrease from the previous year, indicating a market correction after the 2022 surge.
Table of content
- 1. Disclaimer
- 2. Terms of use of the report
- 3. Product codes in the statistical classifications used in the report
-
4. Key Market Indicators and Trends
-
4.1. Key Market Indicators
-
4.1.1. In value
- 4.1.1.1. Production, 2018-2023
- 4.1.1.2. Imports, 2018-2024
- 4.1.1.3. Exports, 2018-2024
- 4.1.1.4. Market size, 2018-2023
-
4.1.1. In value
- 4.2. Market Trends and Factors
-
4.1. Key Market Indicators
-
5. Production
-
5.1. Production in Iran
- 5.1.1. Annual dynamics of production in Iran in kind, 2018-2023, t
- 5.1.2. Annual dynamics of production in Iran in value, 2018-2023, $ US
-
5.2. Global production by Country, 2018-2023
- 5.2.1. Annual dynamics of production by macroregions in kind, 2018-2023, t
- 5.2.2. Dynamics of production structure by macroregions in kind, 2018-2023
- 5.2.3. Annual dynamics of production by country in kind, 2018-2023, t
- 5.2.4. Structure of production by countries in kind, 2018-2023
- 5.2.5. Dynamics of peoduction structure by countries in kind, 2018-2023
-
5.1. Production in Iran
-
6. Imports
-
6.1. Imports (Direct Data*)
- 6.1.1. Imports - Total information
-
6.1.2. Imports in kind, t
- 6.1.2.1. Annual dynamics of product's imports to Iran in kind, 2018-2024, t
- 6.1.2.2. Dynamics of product's imports in kind to Iran by countries, 2018-2024, t
- 6.1.2.3. Structure of product's imports in kind by countries, 2018-2024
-
6.1.3. Imports in value, K $ US
- 6.1.3.1. Annual dynamics of product's imports to Iran in value, 2018-2024, K $ US
- 6.1.3.2. Dynamics of product's imports in value to Iran by countries, 2018-2024, K $ US
- 6.1.3.3. Structure of product's imports in value by countries, 2018-2024
-
6.1.4. Average price of product's imports, $ US/t
- 6.1.4.1. Annual dynamics of average price of product's imports to Iran, 2018-2024, $ US/t
- 6.1.4.2. Dynamics of average price of product's imports to Iran by countries, 2018-2024, $ US/t
-
6.2. Imports (Mirror Data)
- 6.2.1. Imports - Total information
-
6.2.2. Imports in kind, t
- 6.2.2.1. Annual dynamics of product's imports to Iran in kind, 2018-2024, t
- 6.2.2.2. Dynamics of product's imports in kind to Iran by countries, 2018-2024, t
- 6.2.2.3. Structure of product's imports in kind by countries, 2018-2024
-
6.2.3. Imports in value, K $ US
- 6.2.3.1. Annual dynamics of product's imports to Iran in value, 2018-2024, K $ US
- 6.2.3.2. Dynamics of product's imports in value to Iran by countries, 2018-2024, K $ US
- 6.2.3.3. Structure of product's imports in value by countries, 2018-2024
-
6.2.4. Average price of product's imports, $ US/t
- 6.2.4.1. Annual dynamics of average price of product's imports to Iran, 2018-2024, $ US/t
- 6.2.4.2. Dynamics of average price of product's imports to Iran by countries, 2018-2024, $ US/t
-
6.1. Imports (Direct Data*)
-
7. Exports
-
7.1. Exports (Direct Data*)
- 7.1.1. Exports - Total information
-
7.1.2. Exports in kind, t
- 7.1.2.1. Annual dynamics of product's exports from Iran in kind, 2018-2024, t
- 7.1.2.2. Dynamics of product's exports in kind from Iran by countries, 2018-2024, t
- 7.1.2.3. Structure of product's exports in kind by countries, 2018-2024
-
7.1.3. Exports in value, K $ US
- 7.1.3.1. Annual dynamics of product's exports from Iran in value, 2018-2024, K $ US
- 7.1.3.2. Dynamics of product's exports in value from Iran by countries, 2018-2024, K $ US
- 7.1.3.3. Structure of product's exports in value by countries, 2018-2024
-
7.1.4. Average price of product's exports, $ US/t
- 7.1.4.1. Annual dynamics of average price of product's exports from Iran, 2018-2024, $ US/t
- 7.1.4.2. Dynamics of average price of product's exports from Iran by countries, 2018-2024, $ US/t
-
7.2. Exports (Mirror Data)
- 7.2.1. Exports - Total information
-
7.2.2. Exports in kind, t
- 7.2.2.1. Annual dynamics of product's exports from Iran in kind, 2018-2024, t
- 7.2.2.2. Dynamics of product's exports in kind from Iran by countries, 2018-2024, t
- 7.2.2.3. Structure of product's exports in kind by countries, 2018-2024
-
7.2.3. Exports in value, K $ US
- 7.2.3.1. Annual dynamics of product's exports from Iran in value, 2018-2024, K $ US
- 7.2.3.2. Dynamics of product's exports in value from Iran by countries, 2018-2024, K $ US
- 7.2.3.3. Structure of product's exports in value by countries, 2018-2024
-
7.2.4. Average price of product's exports, $ US/t
- 7.2.4.1. Annual dynamics of average price of product's exports from Iran, 2018-2024, $ US/t
- 7.2.4.2. Dynamics of average price of product's exports from Iran by countries, 2018-2024, $ US/t
-
7.1. Exports (Direct Data*)
-
8. Trade balance
-
8.1. Trade balance (Direct Data)
- 8.1.1. In kind, t
- 8.1.2. In value, K $ US
-
8.2. Trade balance (Mirror Data)
- 8.2.1. In kind, t
- 8.2.2. In value, K $ US
-
8.1. Trade balance (Direct Data)
-
9. Top buying and selling countries, 2018-2024
-
9.1. Direct Data
- 9.1.1. Import in Value by Countries-buyers
- 9.1.2. Export in Value by Countries-suppliers
-
9.2. Mirror Data
- 9.2.1. Import in Value by Countries-buyers
- 9.2.2. Export in Value by Countries-suppliers
-
9.1. Direct Data
Production flour or powder of dried legumes in Iran
In kind, 2017-2020, t
Between 2017 and 2020, Iran ranked 17th globally in the production of flour or powder made from dried legumes.
Top producers of flour or powder of dried legumes, 2017-2020
World map of production of flour or powder of dried legumes, 2017-2020
Production of flour or powder from dried legumes in Iran declined for the third year in a row. In 2020, Iran produced 6 988 tonnes, a decrease of 1.6% compared to the previous year. Over the 2017-2020 period, production fell by 31.2%, with an average annual decline of 11.7%.
Annual dynamics of production in Iran in kind, 2017-2020, t
| Parameter | 2018 | 2019 | 2020 | CAGR | |
|---|---|---|---|---|---|
| 1 | Change from last year | (19.1%) | (13.6%) | (1.6%) | (11.7%) |
In value, 2017-2020, K $ US
The value of flour or powder from dried legumes produced in Iran dropped for the third consecutive year. In 2020, output was valued at 8 521 thousand US dollars, down 17.1% from the year before. From 2017 to 2020, production value decreased by 58.4%, with an average annual decline of 25.4%.
Annual dynamics of production in Iran in value, 2017-2020, K $ US
| Parameter | 2018 | 2019 | 2020 | CAGR | |
|---|---|---|---|---|---|
| 1 | Change from last year | (25.2%) | (32.9%) | (17.1%) | (25.4%) |
Exports flour or powder of dried legumes from Iran
Exports in kind, kg
The export market for flour or powder of dried legumes from Iran showed significant volatility during the observed period. Exports reached their lowest point in 2017 and peaked in 2018, with a 3.3-fold difference between these years. In 2020, exports totaled 14 472 kilograms, marking a sharp increase of 109.5% year-over-year. The highest volume was recorded in 2018 at 14 703 kilograms. The largest decline occurred in 2019, falling by 53.0%, while the largest increase was in 2018, rising by 229.4%.
Annual dynamics of product's exports from Iran in kind, 2017-2020, kg
| Parameter | 2018 | 2019 | 2020 | CAGR | |
|---|---|---|---|---|---|
| 1 | Change from last year | 229.4% | (53.0%) | 109.5% | 48.0% |
From 2017 to 2020, three key markets—Canada, Australia, and Uzbekistan—collectively accounted for 50.7% of Iran's total exports of flour or powder from dried legumes in volume terms.
Structure of product's exports in kind by countries, 2017-2020
World map of product's exports from Iran in kind, 2017-2020
Exports in value, $ US
The export market in value terms exhibited notable volatility over the period. Exports hit their minimum in 2017 and their maximum in 2018, with a 3-fold variation between these years. In 2020, Iran exported 17 647 US dollars worth of flour or powder from dried legumes, representing a sharp rise of 76.5% compared to the previous year. The peak value was recorded in 2018 at 27 436 US dollars. The largest decline was in 2019, dropping by 63.6%, while the largest increase occurred in 2018, surging by 204.7%.
Annual dynamics of product's exports from Iran in value, 2017-2020, $ US
| Parameter | 2018 | 2019 | 2020 | CAGR | |
|---|---|---|---|---|---|
| 1 | Change from last year | 204.7% | (63.6%) | 76.5% | 25.1% |
Between 2017 and 2020, Australia, Canada, and the Netherlands consistently led as the top destinations for Iran's exports of flour or powder from dried legumes in value terms. Australia accounted for 26.0% of exports, Canada for 21.7%, and the Netherlands for 9.7%, together making up 57.5% of total export flows.
Structure of product's exports in value by countries, 2017-2020
World map of product's exports from Iran in value, 2017-2020
Imports flour or powder of dried legumes to Iran
Imports in kind, kg
In 2018, Iran's imports of flour or powder from dried legumes totaled 1 005 kilograms, an increase of 97.1% compared to the previous year.
Annual dynamics of product's imports to Iran in kind, 2017-2020, kg
| Parameter | 2018 | 2019 | 2020 | CAGR | |
|---|---|---|---|---|---|
| 1 | Change from last year | 97.1% | n/a | n/a | - |
From 2017 to 2020, imports in volume terms were entirely concentrated on Italy, which accounted for 100.0% of total flows.
Structure of product's imports in kind by countries, 2017-2020
World map of product's imports to Iran in kind, 2017-2020
Imports in value, $ US
In 2018, Iran imported 1 366 US dollars worth of flour or powder from dried legumes, showing a significant advance of 86.4% over the previous year.
Annual dynamics of product's imports to Iran in value, 2017-2020, $ US
| Parameter | 2018 | 2019 | 2020 | CAGR | |
|---|---|---|---|---|---|
| 1 | Change from last year | 86.4% | n/a | n/a | - |
Throughout 2017-2020, Italy was the sole key partner for Iran's imports of flour or powder from dried legumes in value terms, representing 100.0% of total flows.
Structure of product's imports in value by countries, 2017-2020
World map of product's imports to Iran in value, 2017-2020
Related Reports


2026-03-28


Maize flour and cereals market in Iran
2026-03-30

In-shell almonds market in Iran
2026-03-28
Why Choose Us?
Only Verified Data
No Hidden Costs or Separate Fees
Smarter Subscription Pricing
Contact Our Team
Submit your inquiry using the form below — our team will get back to you within 24 hours.