Indonesia's fruit imports jump 31.9% to 411,156 tonnes as China takes 85.6% of the market
Indonesia imported 411,156 tonnes of fruit in the first five months of 2026, up 31.9% year on year, with the bill rising to US$819 million from US$644.5 million. Pears, mandarins, apples and grapes made up 96.7% of volume, and China supplied 85.6% of the main categories. Australian pear shipments fell to 61 tonnes and US apple supply to 5,819 tonnes.
Indonesia's fruit imports rose 31.9% year on year to 411,156 tonnes in the first five months of 2026, while the import bill climbed to US$819 million from US$644.5 million in the same period of 2025, according to Mashable Indonesia. In local currency the value was put at about Rp 14.5 trillion.
Value grew more slowly than volume — roughly 27% against 31.9% — which means the average landed price per kilogram fell over the year. Cheap fresh fruit, above all from China, where output is recovering, drove the increase. Premium categories such as grapes, stonefruit and berries retained a separate market built on quality and presentation rather than price.
Four fruits carry the market
Pears, mandarins, apples and grapes together accounted for 96.7% of import volume and 95.3% of import value in early 2026. Growth was concentrated in the three cheapest of them: pears up 50.2%, mandarins up 35.4% and apples up 29.1%. Grapes, the most expensive of the four, did not post comparable growth.
CIF prices explain the pattern:
- Pears: US$1.48 per kg
- Mandarins: US$1.73 per kg
- Apples: US$2.02 per kg
China accounted for 85.6% of the market across the main imported fruit categories. Its ability to ship very large volumes at low prices matches an Indonesian consumer base that is expanding and highly price-sensitive.
Pears and apples: rivals pushed out
Pears were the fastest-growing line in the Indonesian market, rising 50.2% from 94,293 tonnes a year earlier to 141,596 tonnes. China supplied roughly 97% of that volume. South Africa shipped 4,000 tonnes of Packham pears, while Australian shipments collapsed to 61 tonnes.
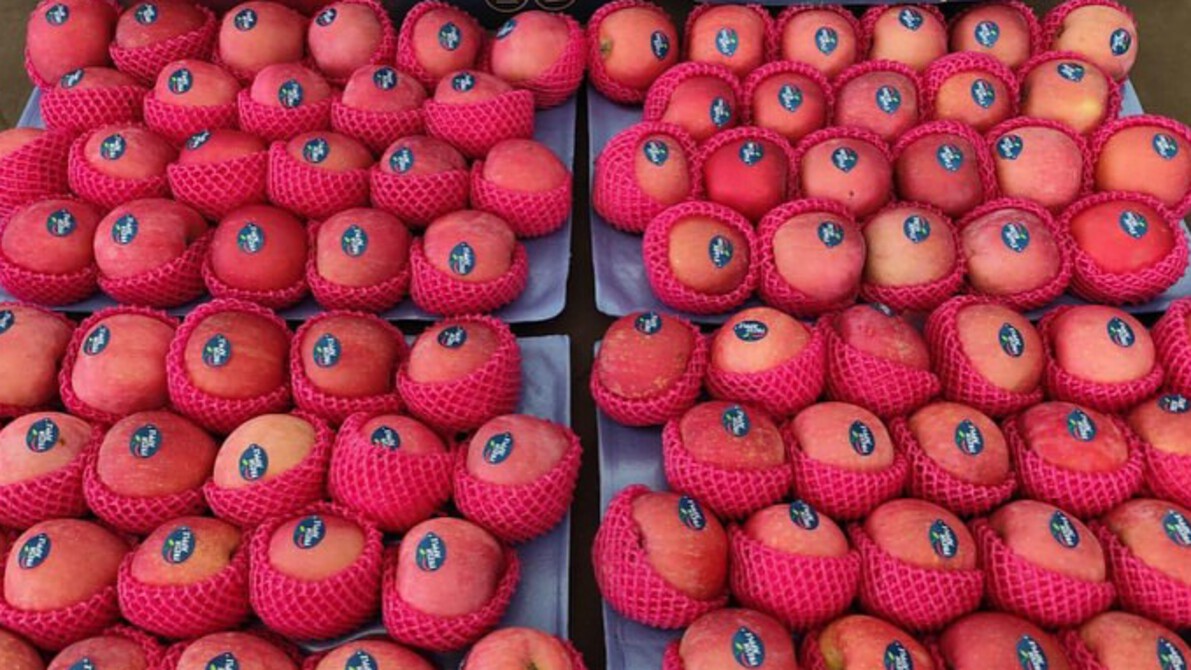
Apple imports rose 29.1% to 94,322 tonnes, of which China supplied 87,249 tonnes. The United States held second place with 5,819 tonnes, down on the year, and Southern Hemisphere suppliers New Zealand and South Africa also saw volumes shrink.
Mandarin imports climbed 35.4% to 118,376 tonnes. China accounted for 107,990 tonnes, while Pakistan established a position with 10,337 tonnes — the only significant new origin in the category.
Citrus splits, grapes stay contested
Sweet orange imports rose to 8,898 tonnes, with Chinese supply increasing while the United States and Egypt lost ground. Lemons moved the other way, falling from 3,091 tonnes to 1,962 tonnes as Chinese shipments nearly halved.
Grapes remain the one large category China does not dominate. Australia leads with about 27,000 tonnes and a 62.8% share, on quality, flavour and food-safety credentials valued by Indonesia's middle class, which increasingly selects on berry size, sweetness, crunch and packaging rather than price alone. China's grape share has nonetheless risen to 27.4% on rapidly improving quality and far more competitive pricing.
Niche categories
Smaller premium lines show the same competitive pressure at much lower volumes:
- Kiwifruit, 2,005 tonnes: New Zealand 935 tonnes, China 805 tonnes
- Plums, 498 tonnes and growing on the year: Australia 398 tonnes, ahead of South Africa
- Peaches and nectarines, 52 tonnes, up slightly, led by Australia
- Strawberries, 268 tonnes: South Korea 245 tonnes
Mashable Indonesia attributes the surge to an expanding consumer base seeking affordable fresh produce, met by recovering Chinese production. For suppliers outside China, the numbers point to a market splitting into a high-volume commodity tier priced at around US$1.50 to US$2.00 per kilogram and a much smaller premium tier where origin, variety and presentation still command a margin.