AF&PA puts 2025 US recovered paper volume at 45 million tons, 33 million tons of it cardboard
The American Forest & Paper Association has calculated the volume of paper recovered for recycling in the United States in 2025 at 45 million tons, Recycling Today reported. Some 33 million tons of that total are classified as cardboard, roughly 73 percent of the pool. The figure sets the practical ceiling on recycled fiber available to domestic mills and export buyers.
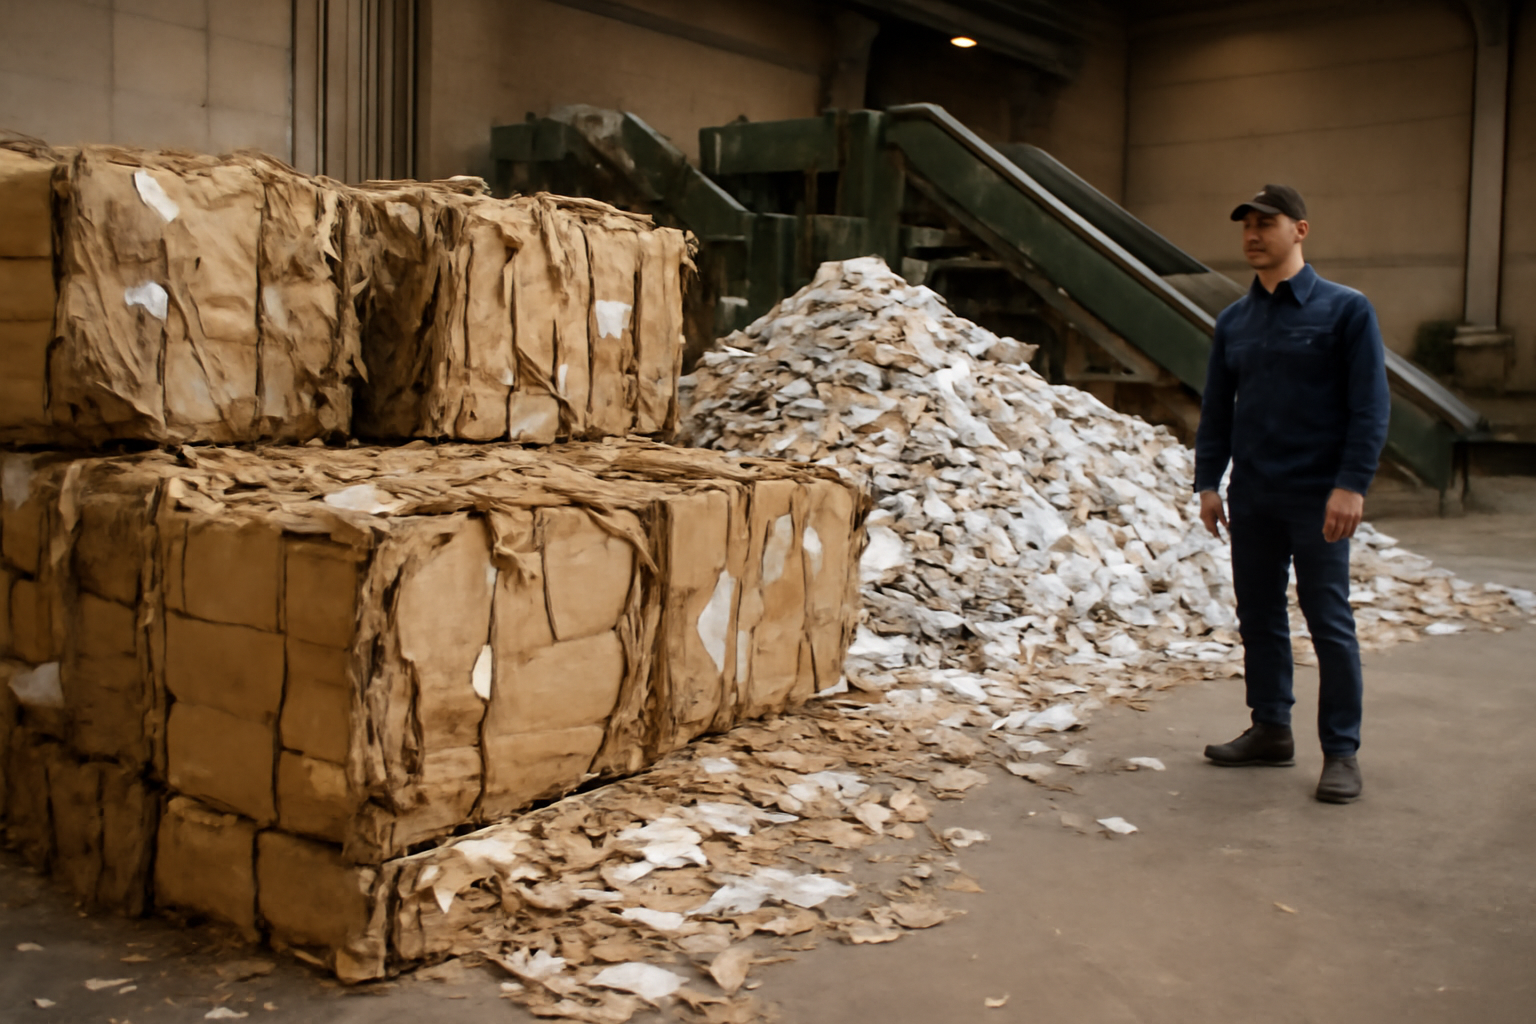
Association puts the 2025 pool at 45 million tons
The American Forest & Paper Association (AF&PA) has calculated the volume of paper recovered for recycling in the United States in 2025 at 45 million tons, Recycling Today reported. The association classifies some 33 million tons of that total as cardboard.
The two numbers define the raw material base that was available to US paper and board mills over the past year. Recovered paper is the principal furnish for containerboard, boxboard and a large share of the tissue produced in North America, so the size of the collected pool sets a practical ceiling on how much recycled-content capacity the country can run without importing fiber or bidding tons away from other buyers.
Cardboard accounts for roughly 73 percent of the 2025 total. The remaining 12 million tons are spread across all other recovered grades — a comparatively narrow base for any mill that cannot run on corrugated material alone, and one that leaves the national figure highly sensitive to what happens in a single stream.
Supply follows consumption, not mill demand
Recovered paper is a by-product of consumption rather than a crop or an extracted commodity. Tons are generated when goods are shipped, unpacked and discarded, which means availability tracks retail activity, e-commerce volumes and industrial output rather than the order books of the mills that buy the material. A price signal does not create additional supply the way it can in agriculture or mining.
That asymmetry matters for anyone planning around the 45 million ton figure:
- Collection cannot be scaled up quickly in response to higher prices, unlike a harvest or mine output.
- The cardboard share concentrates supply risk in one stream tied directly to packaging demand.
- Grades outside cardboard depend heavily on residential collection, where quality and contamination are harder to control.
- Mills adding recycled-content capacity compete for tons that already have committed buyers.
Implications for packaging producers and traders
For packaging producers, the AF&PA number is a supply-side reference point rather than a demand indicator. Investment in recycled containerboard and boxboard capacity is ultimately constrained by how many usable tons the domestic collection system generates each year; with the pool at 45 million tons, new machines draw on the same volume rather than on incremental supply, and the competition shows up in fiber costs.
The figure also frames the export side of the market. The United States has long been a significant supplier of recovered fiber to mills abroad, and every ton shipped out is a ton unavailable to a domestic machine. When the collected pool is broadly flat, the split between export sales and domestic mill consumption becomes the main variable behind price movements, rather than any change in collection itself. The 33 million ton cardboard figure is therefore the number buyers on both sides of that split will watch most closely.
AF&PA's calculation covers volume recovered, not the end use of that volume. Recycling Today's report does not break the 45 million tons down by destination, nor by grade beyond the cardboard category. Producers, traders and importers will need subsequent releases from the association to see how the tonnage divides between domestic mill consumption and export shipments, and how the non-cardboard 12 million tons are composed.