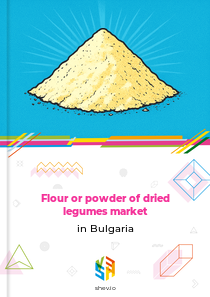







Earlier Report Observations
The market for flour and powder of dried legumes in Bulgaria contracted from over 1,500 tons in 2018 to 788 tons in 2022. This decline was primarily driven by a sustained reduction in the cultivated area for leguminous crops, which consistently limited the domestic raw material base for production throughout the period. The market faced additional pressure in 2021 due to ongoing logistical and economic challenges related to the COVID-19 pandemic.
A slight production increase to 786 tons occurred in 2023, with the total market volume reaching 777 tons. This stabilization was supported by the entry of new players like MITEX EOOD, which expanded into the packaging and production of legume flour. Concurrently, local legume production continued to shrink, leading to increased reliance on imports as traditional varieties like the Bulgarian bean nearly disappeared from the market, a trend highlighted by updated EU labeling rules for product origin that came into effect that year.
Recent regulatory changes are shaping the market environment. From 2024, new crop rotation standards (DZES 7) require the inclusion of leguminous crops to improve soil ecology. However, producers also contend with rising costs for raw materials and energy, while a decrease in production investments and the cessation of some company operations pose challenges to future output.
Table of content
- 1. Disclaimer
- 2. Terms of use of the report
- 3. Product codes in the statistical classifications used in the report
-
4. Key Market Indicators and Trends
-
4.1. Key Market Indicators
-
4.1.1. In kind
- 4.1.1.1. Production, 2018-2023
- 4.1.1.2. Imports, 2018-2024
- 4.1.1.3. Exports, 2018-2024
- 4.1.1.4. Market size, 2018-2023
-
4.1.1. In kind
- 4.2. Market Trends and Factors
-
4.1. Key Market Indicators
-
5. Production
-
5.1. Production in Bulgaria
- 5.1.1. Annual dynamics of production in Bulgaria in kind, 2018-2023, t
- 5.1.2. Annual dynamics of production in Bulgaria in value, 2018-2023, $ US
-
5.2. Global production by Country, 2018-2023
- 5.2.1. Annual dynamics of production by macroregions in kind, 2018-2023, t
- 5.2.2. Dynamics of production structure by macroregions in kind, 2018-2023
- 5.2.3. Annual dynamics of production by country in kind, 2018-2023, t
- 5.2.4. Structure of production by countries in kind, 2018-2023
- 5.2.5. Dynamics of peoduction structure by countries in kind, 2018-2023
-
5.1. Production in Bulgaria
-
6. Imports
-
6.1. Imports (Direct Data)
- 6.1.1. Imports - Total information
-
6.1.2. Imports in kind, kg
- 6.1.2.1. Annual dynamics of product's imports to Bulgaria in kind, 2018-2024, kg
- 6.1.2.2. Dynamics of product's imports in kind to Bulgaria by countries, 2018-2024, kg
- 6.1.2.3. Structure of product's imports in kind by countries, 2018-2024
-
6.1.3. Imports in value, K $ US
- 6.1.3.1. Annual dynamics of product's imports to Bulgaria in value, 2018-2024, K $ US
- 6.1.3.2. Dynamics of product's imports in value to Bulgaria by countries, 2018-2024, K $ US
- 6.1.3.3. Structure of product's imports in value by countries, 2018-2024
-
6.1.4. Average price of product's imports, $ US/t
- 6.1.4.1. Annual dynamics of average price of product's imports to Bulgaria, 2018-2024, $ US/t
- 6.1.4.2. Dynamics of average price of product's imports to Bulgaria by countries, 2018-2024, $ US/t
-
6.2. Imports (Mirror Data)
- 6.2.1. Imports - Total information
-
6.2.2. Imports in kind, kg
- 6.2.2.1. Annual dynamics of product's imports to Bulgaria in kind, 2018-2024, kg
- 6.2.2.2. Dynamics of product's imports in kind to Bulgaria by countries, 2018-2024, kg
- 6.2.2.3. Structure of product's imports in kind by countries, 2018-2024
-
6.2.3. Imports in value, K $ US
- 6.2.3.1. Annual dynamics of product's imports to Bulgaria in value, 2018-2024, K $ US
- 6.2.3.2. Dynamics of product's imports in value to Bulgaria by countries, 2018-2024, K $ US
- 6.2.3.3. Structure of product's imports in value by countries, 2018-2024
-
6.2.4. Average price of product's imports, $ US/t
- 6.2.4.1. Annual dynamics of average price of product's imports to Bulgaria, 2018-2024, $ US/t
- 6.2.4.2. Dynamics of average price of product's imports to Bulgaria by countries, 2018-2024, $ US/t
-
6.1. Imports (Direct Data)
-
7. Exports
-
7.1. Exports (Direct Data)
- 7.1.1. Exports - Total information
-
7.1.2. Exports in kind, kg
- 7.1.2.1. Annual dynamics of product's exports from Bulgaria in kind, 2018-2024, kg
- 7.1.2.2. Dynamics of product's exports in kind from Bulgaria by countries, 2018-2024, kg
- 7.1.2.3. Structure of product's exports in kind by countries, 2018-2024
-
7.1.3. Exports in value, K $ US
- 7.1.3.1. Annual dynamics of product's exports from Bulgaria in value, 2018-2024, K $ US
- 7.1.3.2. Dynamics of product's exports in value from Bulgaria by countries, 2018-2024, K $ US
- 7.1.3.3. Structure of product's exports in value by countries, 2018-2024
-
7.1.4. Average price of product's exports, $ US/t
- 7.1.4.1. Annual dynamics of average price of product's exports from Bulgaria, 2018-2024, $ US/t
- 7.1.4.2. Dynamics of average price of product's exports from Bulgaria by countries, 2018-2024, $ US/t
-
7.2. Exports (Mirror Data)
- 7.2.1. Exports - Total information
-
7.2.2. Exports in kind, kg
- 7.2.2.1. Annual dynamics of product's exports from Bulgaria in kind, 2018-2024, kg
- 7.2.2.2. Dynamics of product's exports in kind from Bulgaria by countries, 2018-2024, kg
- 7.2.2.3. Structure of product's exports in kind by countries, 2018-2024
-
7.2.3. Exports in value, K $ US
- 7.2.3.1. Annual dynamics of product's exports from Bulgaria in value, 2018-2024, K $ US
- 7.2.3.2. Dynamics of product's exports in value from Bulgaria by countries, 2018-2024, K $ US
- 7.2.3.3. Structure of product's exports in value by countries, 2018-2024
-
7.2.4. Average price of product's exports, $ US/t
- 7.2.4.1. Annual dynamics of average price of product's exports from Bulgaria, 2018-2024, $ US/t
- 7.2.4.2. Dynamics of average price of product's exports from Bulgaria by countries, 2018-2024, $ US/t
-
7.1. Exports (Direct Data)
-
8. Trade balance
-
8.1. Trade balance (Direct Data)
- 8.1.1. In kind, kg
- 8.1.2. In value, K $ US
-
8.2. Trade balance (Mirror Data)
- 8.2.1. In kind, kg
- 8.2.2. In value, K $ US
-
8.1. Trade balance (Direct Data)
-
9. Top buying and selling countries, 2018-2024
-
9.1. Direct Data
- 9.1.1. Import in Value by Countries-buyers
- 9.1.2. Export in Value by Countries-suppliers
-
9.2. Mirror Data
- 9.2.1. Import in Value by Countries-buyers
- 9.2.2. Export in Value by Countries-suppliers
-
9.1. Direct Data
Production flour or powder of dried legumes in Bulgaria
In kind, 2017-2020, t
Top producers of flour or powder of dried legumes, 2017-2020
World map of production of flour or powder of dried legumes, 2017-2020
Bulgaria's production of flour or powder from dried legumes increased in 2020, following a two-year decline. The country produced 987 tonnes that year, representing a moderate 6.3% year-over-year rise. However, looking at the broader period from 2017 to 2020, production actually decreased by 67.3%, which translates to an average annual decline of 31.1%. The lowest production level was recorded in 2019 at 929 tonnes, while the most significant drop occurred in 2018 with a 50.0% decrease.
Annual dynamics of production in Bulgaria in kind, 2017-2020, t
| Parameter | 2018 | 2019 | 2020 | CAGR | |
|---|---|---|---|---|---|
| 1 | Change from last year | (50.0%) | (38.5%) | 6.3% | (31.1%) |
Exports flour or powder of dried legumes from Bulgaria
Exports in kind, kg
Bulgaria's exports of flour or powder from dried legumes grew for the third consecutive year in 2020. The export volume reached 31 050 kilograms, showing a sharp increase of 58.5% compared to the previous year. Over the four-year period from 2017 to 2020, exports surged by 5 504.7%, averaging an annual growth rate of 282.7%.
Annual dynamics of product's exports from Bulgaria in kind, 2017-2020, kg
| Parameter | 2018 | 2019 | 2020 | CAGR | |
|---|---|---|---|---|---|
| 1 | Change from last year | 1 224.0% | 167.1% | 58.5% | 282.7% |
From 2017 to 2020, Germany was the dominant destination for Bulgaria's exports of flour or powder from dried legumes, accounting for 90.0% of the total export volume.
Structure of product's exports in kind by countries, 2017-2020
World map of product's exports from Bulgaria in kind, 2017-2020
Exports in value, K $ US
Bulgaria's export value of flour or powder from dried legumes rose for the third year in a row in 2020. Exports totaled 111.6 thousand US dollars, marking a steep 80.1% increase from 2019. Between 2017 and 2020, export value grew by 2 849.8%, with an average annual rate of 209.0%.
Annual dynamics of product's exports from Bulgaria in value, 2017-2020, K $ US
| Parameter | 2018 | 2019 | 2020 | CAGR | |
|---|---|---|---|---|---|
| 1 | Change from last year | 559.2% | 148.5% | 80.1% | 209.0% |
During the 2017–2020 period, Germany remained the primary market for Bulgaria's exports of flour or powder from dried legumes in value terms, capturing 88.9% of total export value. The remaining share was distributed among other countries.
Structure of product's exports in value by countries, 2017-2020
World map of product's exports from Bulgaria in value, 2017-2020
Imports flour or powder of dried legumes to Bulgaria
Imports in kind, kg
Bulgaria's imports of flour or powder from dried legumes increased for the third consecutive year in 2020. The import volume saw a sharp gain of 137.3% compared to 2019. Over the 2017-2020 period, imports grew by 430.3%, with a compound annual growth rate (CAGR) of 74.4%.
Annual dynamics of product's imports to Bulgaria in kind, 2017-2020, kg
| Parameter | 2018 | 2019 | 2020 | CAGR | |
|---|---|---|---|---|---|
| 1 | Change from last year | 35.1% | 65.3% | 137.3% | 74.4% |
From 2017 to 2020, Turkey and Denmark were the main suppliers of flour or powder from dried legumes to Bulgaria, together accounting for 89.2% of total import volume. The rest was fragmented across other countries.
Structure of product's imports in kind by countries, 2017-2020
World map of product's imports to Bulgaria in kind, 2017-2020
Imports in value, K $ US
Bulgaria's import value of flour or powder from dried legumes rose for the third year in a row in 2020. Imports amounted to 39.0 thousand US dollars, equivalent to an abrupt gain of 102.3% from 2019. Over the 2017-2020 period, import value increased by 364.3%, with a compound annual growth rate (CAGR) of 66.8%.
Annual dynamics of product's imports to Bulgaria in value, 2017-2020, K $ US
| Parameter | 2018 | 2019 | 2020 | CAGR | |
|---|---|---|---|---|---|
| 1 | Change from last year | 49.1% | 54.0% | 102.3% | 66.8% |
Throughout 2017–2020, Turkey, Denmark, and India played leading roles in Bulgaria's imports of flour or powder from dried legumes in value terms. Turkey accounted for 51.5% of import value, Denmark for 21.6%, and India for 13.2%, jointly representing 86.3% of total import flows.
Structure of product's imports in value by countries, 2017-2020
World map of product's imports to Bulgaria in value, 2017-2020
Related Reports


2026-03-28

Wheat starch market in Bulgaria
2026-03-28

Maize flour and cereals market in Bulgaria
2026-03-30

Maize starch market in Bulgaria
2026-03-28
Why Choose Us?
Only Verified Data
No Hidden Costs or Separate Fees
Smarter Subscription Pricing
Contact Our Team
Submit your inquiry using the form below — our team will get back to you within 24 hours.