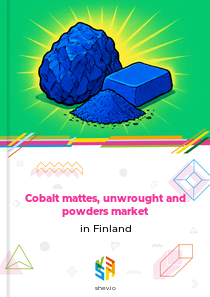







Earlier Report Observations
Finland established itself as the EU's sole producer of cobalt from mines during the late 2010s, setting the stage for its cobalt intermediate products market. By 2020, the country had become the world's second-largest producer of refined cobalt, with output reaching 6 550 t. This was driven significantly by increased global demand for cobalt chemicals, particularly for battery applications in electric vehicles and energy storage.
Production volumes experienced some volatility in the following years. Output declined to 6 011 t in 2021 before recovering to 6 545 t in 2022. The market value in this period rose substantially, from $217.0 million in 2020 to $369.1 million in 2022, reflecting strong cobalt prices and demand.
A shift occurred in 2023, with production falling to 5 180 t and market value dropping sharply to $153.6 million. This period coincided with industry advancements in matte process routes and the scaling up of hydrometallurgical plants in Finland to produce battery-grade cobalt sulfate. Investments continued into 2024, focusing on converting domestic intermediates into high-purity sulfate to meet cathode manufacturers' specifications, supported by Europe's green energy policies. Key player Freeport Cobalt (Finland) remained central to the market, even as annual production edged down to 4 993 t.
Table of content
- 1. Disclaimer
- 2. Terms of use of the report
- 3. Product codes in the statistical classifications used in the report
-
4. Key Market Indicators and Trends
-
4.1. Key Market Indicators
-
4.1.1. In kind
- 4.1.1.1. Production, 2020-2024
- 4.1.1.2. Imports, 2018-2024
- 4.1.1.3. Exports, 2018-2024
- 4.1.1.4. Market size, 2020-2024
-
4.1.2. In value
- 4.1.2.1. Production, 2020-2023
- 4.1.2.2. Imports, 2018-2024
- 4.1.2.3. Exports, 2018-2024
- 4.1.2.4. Market size, 2020-2023
-
4.1.1. In kind
- 4.2. Market Trends and Factors
-
4.1. Key Market Indicators
-
5. Production
-
5.1. Production in Finland
- 5.1.1. In kind, 2020-2024, t
- 5.1.2. In value, 2020-2023, M $ US
-
5.2. Production in the EU, 2019-2024
- 5.2.1. In kind, 2019-2024, t
- 5.2.2. In value, 2019-2024, M $ US
-
5.1. Production in Finland
-
6. Trade balance
-
6.1. Trade balance (Direct Data)
- 6.1.1. In kind, kg
- 6.1.2. In value, $ US
-
6.2. Trade balance (Mirror Data)
- 6.2.1. In kind, kg
- 6.2.2. In value, $ US
-
6.1. Trade balance (Direct Data)
-
7. Top buying and selling countries, 2018-2024
-
7.1. Direct Data
- 7.1.1. Import in Value by Countries-buyers
- 7.1.2. Export in Value by Countries-suppliers
-
7.2. Mirror Data
- 7.2.1. Import in Value by Countries-buyers
- 7.2.2. Export in Value by Countries-suppliers
-
7.1. Direct Data
Production cobalt mattes, unwrought and powders in Finland
In value, 2017-2020, M $ US
Annual dynamics of production in Finland in value, 2017-2020, M $ US
| Parameter | 2018 | 2019 | 2020 | CAGR | |
|---|---|---|---|---|---|
| 1 | Change from last year | n/a | n/a | n/a | - |
In kind, 2017-2020, t
Annual dynamics of production in Finland in kind, 2017-2020, t
| Parameter | 2018 | 2019 | 2020 | CAGR | |
|---|---|---|---|---|---|
| 1 | Change from last year | n/a | n/a | n/a | - |
Exports cobalt mattes, unwrought and powders from Finland
According to market overview data, Finland did not export cobalt mattes, unwrought cobalt, or cobalt powders between 2017 and 2020.
Imports cobalt mattes, unwrought and powders to Finland
Marketing research indicates that Finland did not import cobalt mattes, unwrought cobalt, or cobalt powders from 2017 through 2020.
Related Reports
Cobalt and cobalt articles market in Finland
2026-03-30
Iron or steel fasteners market in Finland
2026-03-30


Why Choose Us?
Only Verified Data
No Hidden Costs or Separate Fees
Smarter Subscription Pricing
Contact Our Team
Submit your inquiry using the form below — our team will get back to you within 24 hours.