Russian Food and Soft-Drink Sales Rise 6.4% in Value and 2.1% in Volume in First Half of 2026
Russia's food and non-alcoholic beverage market grew 6.4% in value and 2.1% in physical volume in the first half of 2026, according to data the analytics firm NTech provided to TASS. Shoppers bought 43.35 million tonnes worth 10.34 trillion rubles. Fish fillet, olive oil and ready meals led volume growth, while confectionery and baby food declined 2%.
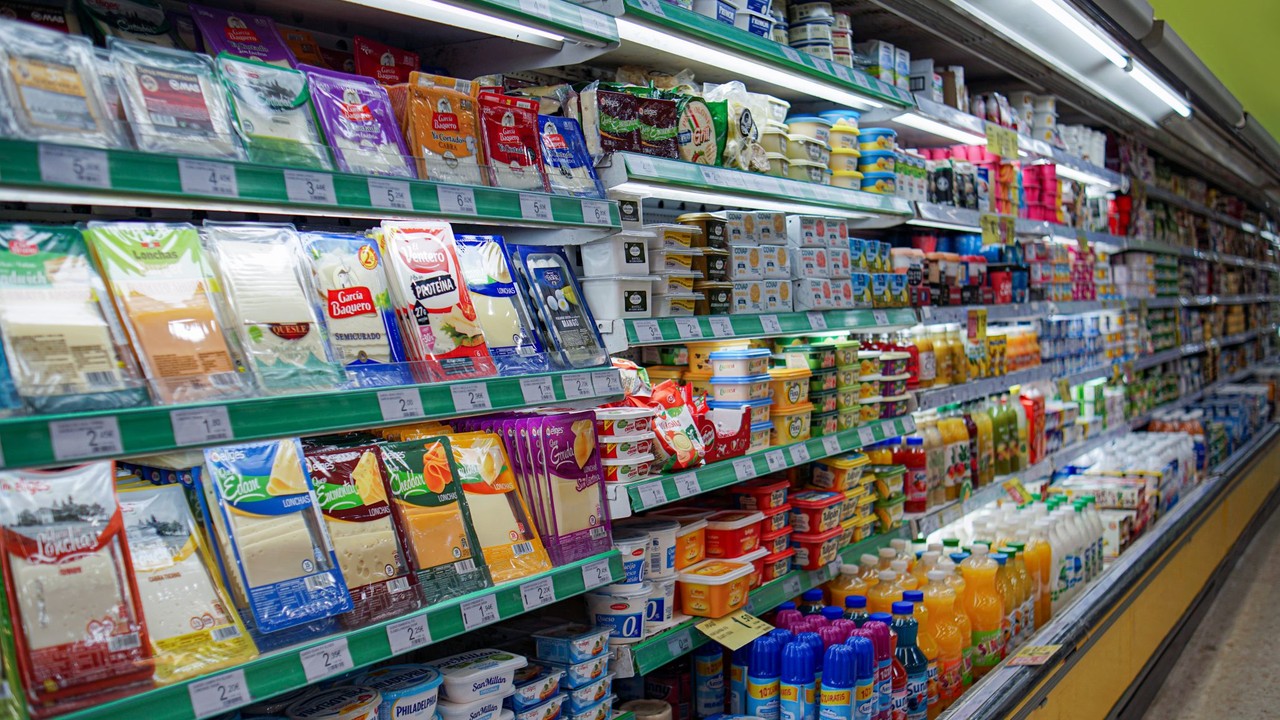
Russia's market for food and non-alcoholic beverages expanded by 6.4% in value and 2.1% in physical volume in the first half of 2026 compared with the same period of 2025, according to data the analytics company NTech supplied to TASS. Over the six months, Russian consumers bought 43.35 million tonnes of food and soft drinks worth 10.34 trillion rubles.
The distance between the two figures defines the period. Value growth ran roughly three times ahead of tonnage, which puts the implied price effect at about 4.2%. Across the whole basket, the average realised price works out at roughly 238,500 rubles per tonne.
Growth continues, but slower than in 2023-2024
Leonid Ardalionov, director of analytics at NTech, said the market continues to grow, although the pace is below the rates recorded in 2023 and 2024. He added that stronger demand for more expensive products does not, in his assessment, indicate a crisis in the food market.
For producers and retailers, the 2.1% volume figure carries more information than the headline value number. It confirms that physical consumption is still expanding rather than simply being repriced. But on a base of 43.35 million tonnes per half-year, a 2.1% gain is a thin margin on which to justify new capacity built for domestic demand alone.
Ready meals, fish and eggs lead volume growth
In physical terms, the strongest gains came from ready-to-eat food, up 14%, eggs and bakery, up 8%, and fish products, up 7%. Within narrower segments the spread was considerably wider:
- fish fillet: up 38%
- olive oil: up 19%
- ready-to-eat food: up 14%
- sausages and other processed meats: up 13%
Two categories moved the other way: sales of confectionery and of baby food each fell 2%. Both are large, established segments, and their decline runs against the overall direction of the market.
Buyers trade down inside premium categories
Ardalionov also pointed to a shift in shopper interest toward relatively inexpensive items within expensive categories. Buyers more often chose cheaper shrimp varieties among seafood, inexpensive kiwi among tropical fruits, and budget brands of milkshakes.
According to Ardalionov, these two opposing tendencies — rising demand for more expensive food on one side, a move toward the cheaper end inside those same categories on the other — are what produce the moderate development of the food market.
What the split means for suppliers
The pattern separates categories where processors can convert growth into margin from those where they cannot. Fish fillet at 38% and olive oil at 19% are import-dependent or processing-intensive lines, and double-digit volume gains there translate into real order books. Ready meals at 14% and sausages at 13% sit with processors rather than primary producers, since both add value after the raw material stage.
In seafood and tropical fruit, by contrast, the extra volume is arriving at the entry price point, which caps what a supplier can extract from the same tonnage. Confectionery and baby food, both down 2%, face the opposite problem: shrinking volumes inside a market whose overall price level rose about 4.2% over the half-year.