Indonesia’s Non-Oil and Gas Exports Rise 6.84% in July as Oils Support Surplus
Indonesia’s non-oil and gas exports reached $25.43 billion in July 2026, rising 6.84% year on year. Animal and vegetable fats and oils remained the largest contributor to the cumulative trade surplus despite a monthly export decline.
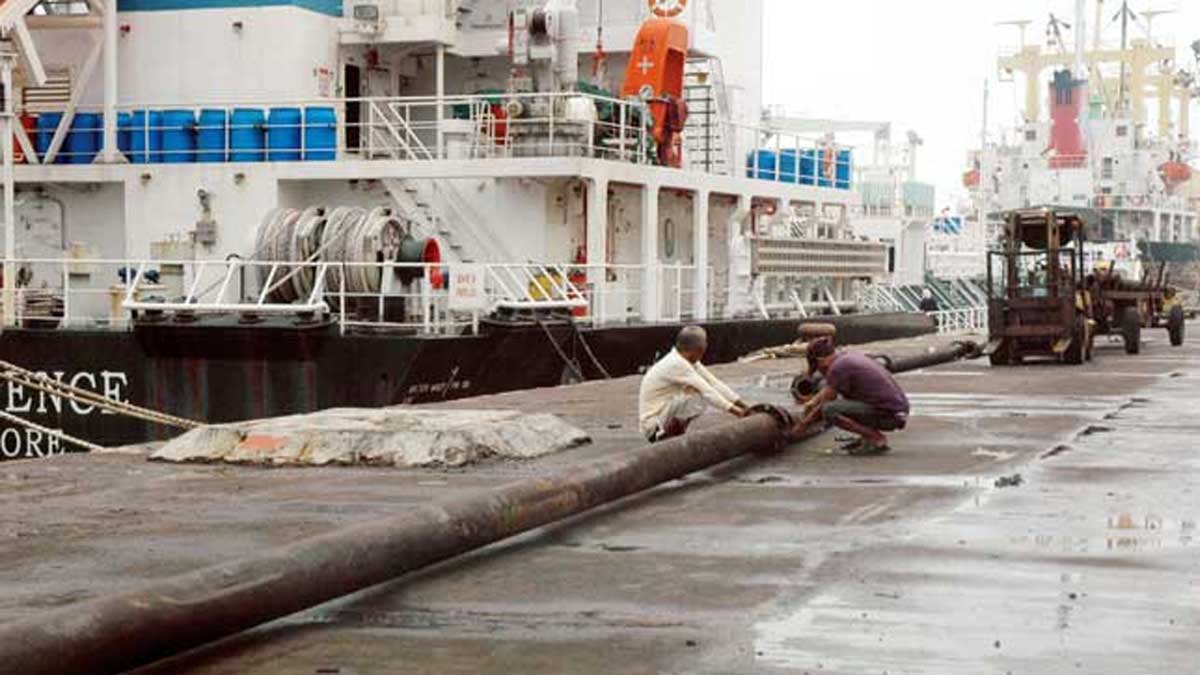
Non-oil and gas shipments drive export growth
Indonesia’s non-oil and gas exports reached $25.43 billion in July 2026, increasing 4.25% from June and 6.84% from July 2025, according to figures from the Ministry of Trade reported by InfoSAWIT. The category accounted for nearly all of the country’s $26.22 billion in total exports during the month.
Total exports rose 2.98% month on month and 6.05% year on year. The improvement extended the growth recorded over the first seven months of 2026, when Indonesia exported goods worth $167.03 billion, 4.43% more than in the corresponding period of 2025. Non-oil and gas exports totaled $160.01 billion in January–July, an increase of 5.21%.
The July trade balance remained positive but narrow. Indonesia recorded an overall surplus of $0.12 billion as a $3.10 billion surplus in non-oil and gas trade offset a $2.98 billion oil and gas deficit. Trade Minister Budi Santoso said the result showed that exports were holding up amid changes in the global economy, while calling for further diversification of export markets and commodities.
Fats and oils lead the cumulative surplus
Animal and vegetable fats and oils, classified under HS 15, were the largest contributor to Indonesia’s merchandise surplus in January–July 2026. The category generated a cumulative surplus of $20.96 billion, ahead of mineral fuels under HS 27 at $16.39 billion and iron and steel under HS 72 at $10.32 billion.
Together, these three commodity groups contributed $7.90 billion to the non-oil and gas surplus in July. Their combined performance was therefore central to compensating for the oil and gas deficit and keeping the national trade balance above zero.
However, exports of animal and vegetable fats and oils fell 6.21% from June. The decline contrasted with strong monthly growth in several other categories: machinery and mechanical equipment exports rose 23.05%, copper and copper articles increased 21.20%, and non-knitted apparel and accessories advanced 20.65%. The figures show that oils remained crucial to the trade balance even as the month’s export growth came from a broader mix of manufactured products.
Manufacturing and Asian markets shape the outlook
Manufacturing remained Indonesia’s main export sector in the first seven months of 2026. Its exports grew 7.16% year on year and represented 82.18% of total shipments. Mining and other activities accounted for 11.73%, oil and gas for 4.20%, and agriculture for 1.89%. Santoso said greater domestic processing and higher value added were necessary to strengthen the competitiveness of Indonesian goods in global markets.
China was the leading destination for Indonesian non-oil and gas exports in January–July, followed by the United States and India. Shipments also recorded rapid growth to Hong Kong, up 36.79%, Turkey, up 30.58%, and Thailand, up 21.92%, according to the ministry figures cited by InfoSAWIT.
For producers and exporters, the data present two distinct signals. Indonesia’s processed industries and expanding Asian markets are supporting aggregate export growth, but the monthly contraction in fats and oils shows that the largest surplus-generating category cannot be assumed to rise continuously. Maintaining the trade surplus will depend on the performance of this established commodity base as well as gains in machinery, metals, apparel and other manufactured goods.