EU carmakers carry €14.4bn in CO2 compliance debt, Italy most exposed — Dataforce
European carmakers have accumulated €14.4 billion in CO2 compliance liabilities against €13 billion in credits, according to a Dataforce report cited by Milano Finanza. Italy is the worst-placed national market at €4.4 billion, while Tesla, BYD and Geely hold the largest credit positions.
European carmakers have built up €14.4 billion in CO2 compliance liabilities under the European Union's fleet emissions rules, against €13 billion in credits held across the market, according to the latest Dataforce report cited by Milano Finanza. Italy is the most exposed national market, with a negative balance of €4.4 billion, while France leads the list of countries in surplus. The biggest single beneficiaries of the trading mechanism are manufacturers based outside the EU.
How the penalty mechanism works
The reference framework is the CAFE (Corporate Average Fuel Economy) regime. From 2025 the average CO2 ceiling for new cars is set at 93.6 grams per kilometre. Manufacturers that exceed it face penalties of €95 for every excess gram, multiplied by the number of vehicles sold. The bill falls due at the end of the 2025-2027 three-year period, so positions accumulated now are provisional in accounting terms but convert into cash at the close of the cycle.
Carmakers above the threshold can avoid fines by buying CO2 quotas from those below it, which has created a working market in emissions debts and credits. In aggregate, Milano Finanza reports, the European car industry holds €14.4 billion of debt against €13 billion of credit. The gap has to be closed either through penalties or through purchases from sellers that are, to a large extent, not European.
Italy, Poland and Germany carry the deficits
Italy's €4.4 billion shortfall reflects average new-car emissions of 111 g/km, which Dataforce puts at 17.4 grams above the EU average. Poland is second with €2.8 billion in prospective fines and average emissions of 123.3 g/km. Germany follows with almost €2.4 billion despite a considerably lower average of 99.1 g/km — evidence that volume, not only fleet mix, drives the final number.
At the opposite end of the table sit the net creditors:
- France: €2.5 billion in credits, average emissions of 83.9 g/km
- Netherlands: €2.4 billion in credits
- Norway: €2.3 billion in credits
Of Europe's three largest markets — Germany with nearly 4.7 million car registrations, France with 2.7 million and Italy with 2.68 million — only one is in surplus.
Volkswagen holds the heaviest single position
Among manufacturers, Volkswagen carries the largest exposure. Dataforce estimates €2.7 billion of CAFE debt at the end of August 2026, up from €2.3 billion in April, a deterioration of €400 million in four months for a group that has just launched a wide-ranging restructuring plan. Stellantis is second with around €1.4 billion in prospective penalties, ahead of Mercedes-Benz at €969 million. All three companies exceed 100 grams of CO2 per kilometre.
Tesla and the Chinese groups on the credit side
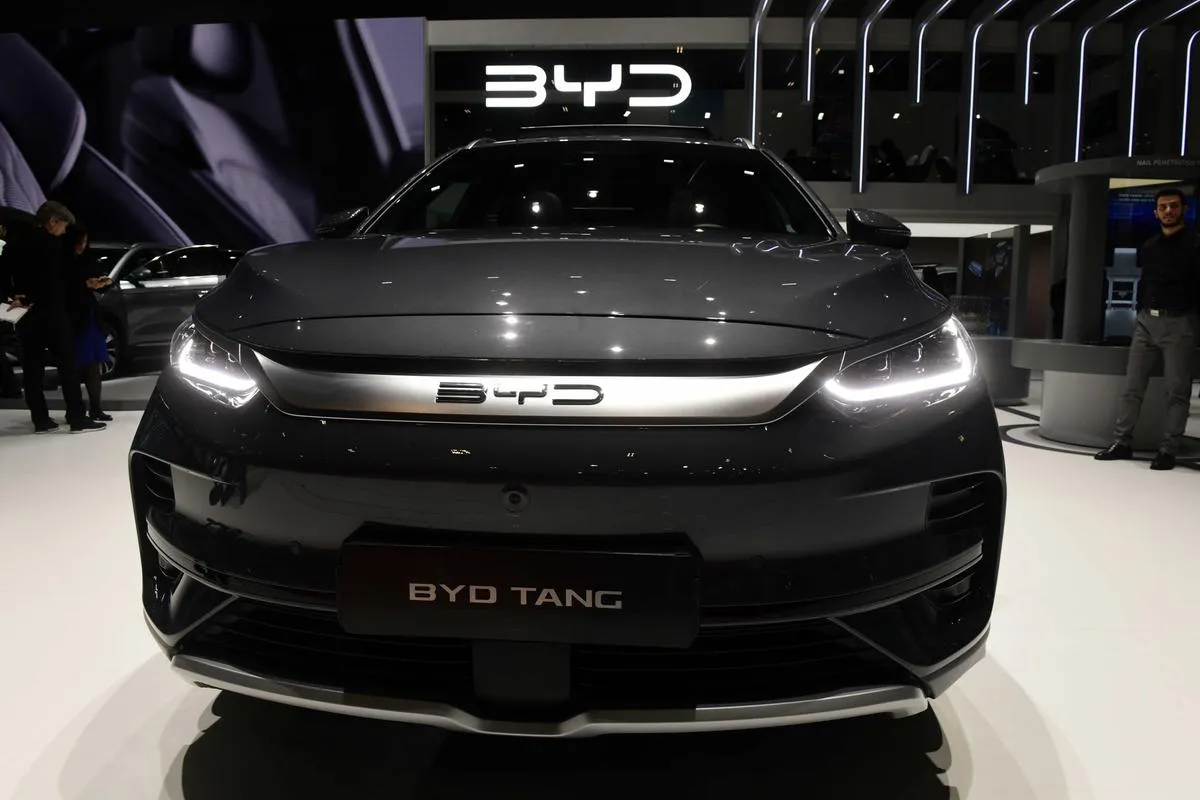
The quota mechanism rewards manufacturers that are further ahead in electrification. Tesla holds the strongest position of any carmaker, with €3 billion in credits. Among the Chinese groups, BYD has €2.2 billion, Geely €1.8 billion and Leapmotor €832 million — just over €4.8 billion combined, more than the accumulated debt of Volkswagen and Stellantis together.
For buyers and sellers of quotas the practical consequence is a transfer of cash from incumbent European groups to competitors that are taking share in the same showrooms. Because settlement lands at the end of 2027, the positions reported by Dataforce are still moving: every percentage point of electric share gained between now and then reduces the bill, and every month of weak electric sales adds to it. Italy, with the widest gap to the 93.6 g/km ceiling among the large markets, has the most ground to make up.